Sheet A-15-CEUS-SSC Project GIS Data Summary
CEUS-SSC Gravity Anomaly Database Grids
Download: ![]() Download GIS Data |
Download GIS Data | ![]() Download PDF Figures for Technical Use
Download PDF Figures for Technical Use
Data Files: CEUS_GRAV_<varies>_CEUSSSC_R0.tif
Data Description: These data sets present gravity anomaly data compiled from several public-domain and unpublished sources for use in the CEUS-SSC Project. Bouguer, free-air, isostatic, and various derivatives of these data sets are provided. Data are presented in milligals (mGal) or mGal per kilometer (mGal/km) as noted below.
File Name |
Data Description |
|---|---|
| CEUS_GRAV_Freeair_CEUSSSC_R0.TIF | Free-air anomaly (mGal) |
| CEUS_GRAV_Bouguer_CEUSSSC_R0.TIF | Complete Bouguer anomaly with free-air anomaly in marine areas (mGal) |
| CEUS_GRAV_RI_CEUSSSC_R0.TIF | Residual isostatic anomaly (mGal) |
| CEUS_GRAV_Isostatic_CEUSSSC_R0.TIF | Regional isostatic anomaly (mGal) |
| CEUS_GRAV_RI_1VD_CEUSSSC_R0.TIF | First vertical derivative of residual isostatic anomaly (mGal/km) |
| CEUS_GRAV_Bouguer_1VD_CEUSSSC_R0.TIF | First vertical derivative of Bouguer with free-air anomaly in marine areas (mGal/km) |
| CEUS_GRAV_Bouguer_LP_240km_CEUSSSC_R0.TIF | Complete Bouguer anomaly (with marine free-air) low pass filtered at 240 km (mGal) |
| CEUS_GRAV_Bouguer_HP_240km_CEUSSSC_R0.TIF | Complete Bouguer anomaly (with marine free-air) high pass filtered at 240 km (mGal) |
| CEUS_GRAV_Bouguer_HP_120km_CEUSSSC_R0.TIF | Complete Bouguer anomaly (with marine free-air) high pass filtered at 120 km (mGal) |
| CEUS_GRAV_Bouguer_UC_40km_CEUSSSC_R0.TIF | Bouguer anomaly with marine free-air anomaly upward continued to 40 km (mGal) |
| CEUS_GRAV_Bouguer_UC_40km_CEUSSSC_R0.TIF | CEUS_GRAV_Bouguer-Bouguer anomaly with marine free-air minus the Bouguer anomaly with marine free-air anomaly upward continued to 40 km (mGal) |
| CEUS_GRAV_Bouguer_UC_100km_CEUSSSC_R0.TIF | Bouguer anomaly with marine free-air anomaly upward continued to 100 km (mGal) |
| CEUS_GRAV_Bouguer-Bouguer_UC_100km_CEUSSSC_R0.TIF | Bouguer anomaly with marine free-air minus the Bouguer anomaly with marine free-air anomaly upward continued to100 km (mGal) |
| CEUS_GRAV_RI_HD_CEUSSSC_R0.TIF | Horizontal derivative of residual isostatic anomaly (mGal/km) |
| CEUS_GRAV_RI_HD_1VD_CEUSSSC_R0.TIF | Horizontal derivative of first vertical derivative of residual isostatic anomaly (mGal/km) |
Shaded relief versions of the above shapefiles are presented where possible. The shaded relief of the gravity anomalies are provided in two versions. Those named with “315hs” in the file name present a shaded relief with a sun orientation of 315 degrees (45 degrees west of north) and a sun angle of 30 degrees above the horizon, while those with “180hs” in the file name present a shaded relief with a sun orientation of 180 degrees (south) and a sun angle of 30 degrees above the horizon.
Source (Internet URL, CD/DVD-ROM): Keller, G.R., 2010, personal communication.
Author/Publisher/Year: CEUS-SSC Project.
Data Summary: Data provided at a grid resolution of 0.033 decimal degrees and converted to TIFF format. Data are presented in geographic coordinates on the North American Datum of 1983.
Disclaimer or Constraints on Use: No constraints have been identified.
Figure A-16
CEUS-SSC free-air gravity anomaly grid. Shaded relief with 315-degree azimuth and 30-degree inclination applied

Figure A-17
CEUS-SSC free-air gravity anomaly grid. Shaded relief with 180-degree azimuth and 30-degree inclination applied
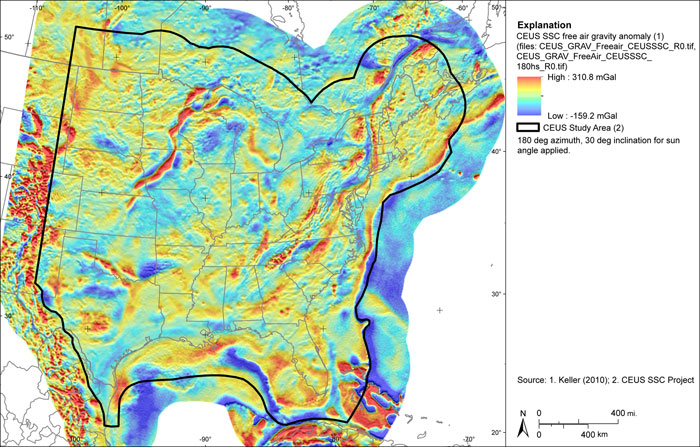
Figure A-18
CEUS-SSC complete Bouguer gravity anomaly grid with free-air gravity anomaly in marine areas. Shaded relief with 315-degree azimuth and 30-degree inclination applied
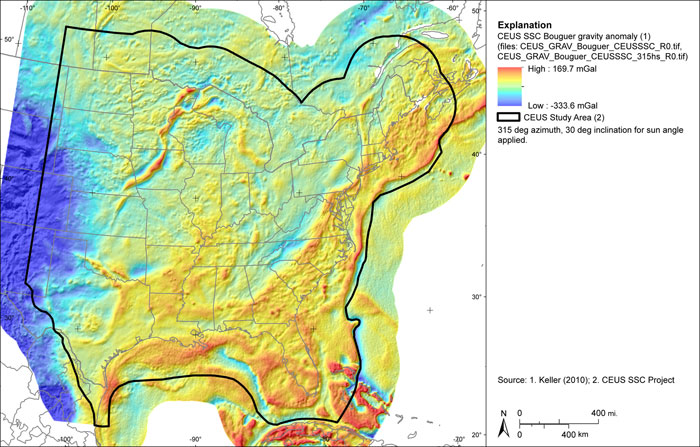
Figure A-19
CEUS-SSC complete Bouguer gravity anomaly grid with free-air gravity anomaly in marine areas. Shaded relief with 180-degree azimuth and 30-degree inclination applied

Figure A-20
CEUS-SSC residual isostatic gravity anomaly grid. Shaded relief with 315 degree azimuth and 30 degree inclination applied
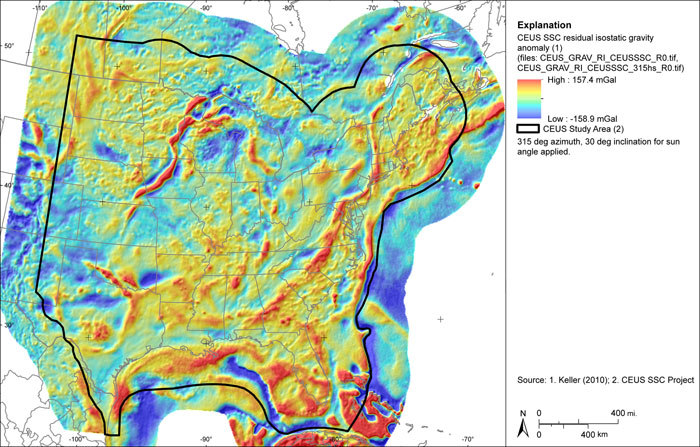
Figure A-21
CEUS-SSC residual isostatic gravity anomaly grid Shaded relief with 180 degree azimuth and 30-degree inclination applied
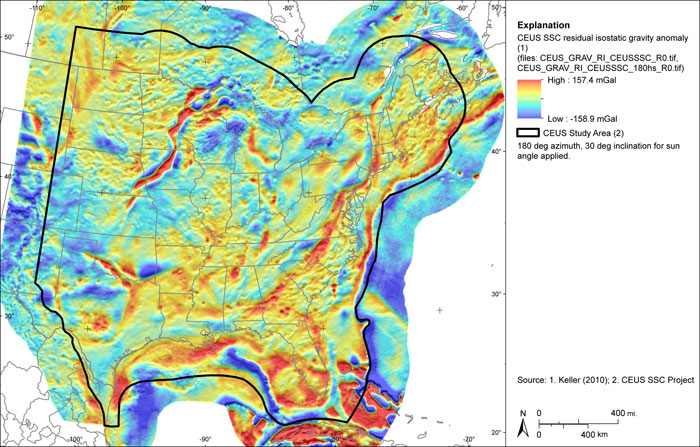
Figure A-22
CEUS-SSC regional isostatic gravity anomaly grid
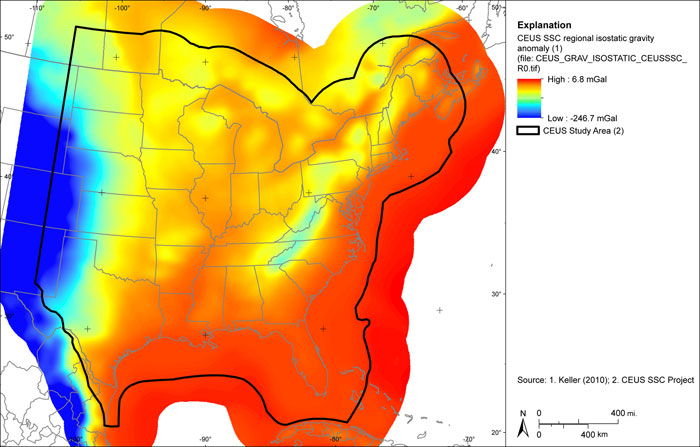
Figure A-23
CEUS-SSC first vertical derivative of residual isostatic gravity anomaly grid
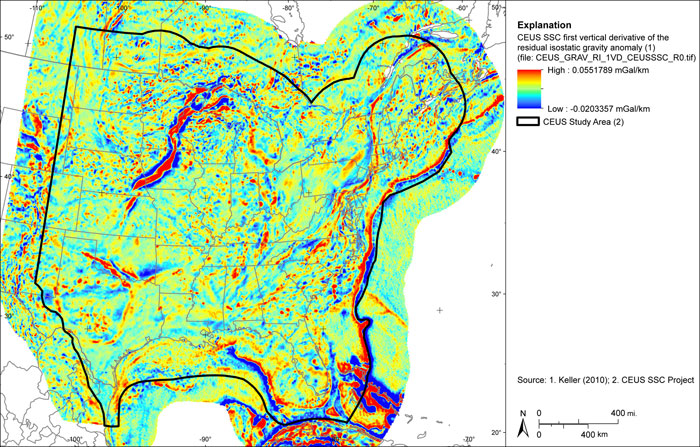
Figure A-24
CEUS-SSC first vertical derivative of Bouguer gravity anomaly grid with free-air anomaly in marine areas
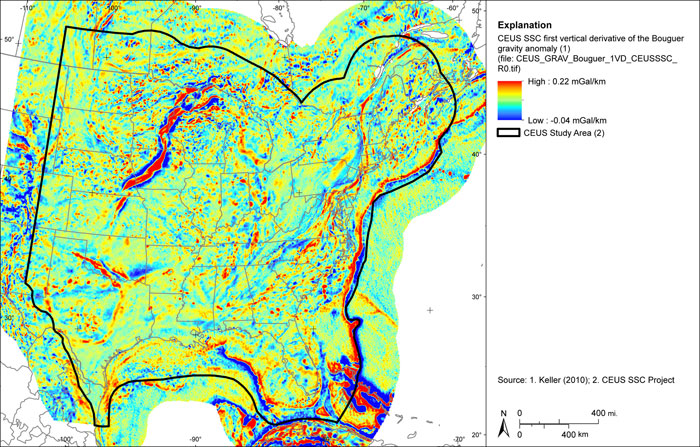
Figure A-25
CEUS-SSC complete Bouguer (with marine free-air) gravity anomaly grid low pass filtered at 240 km
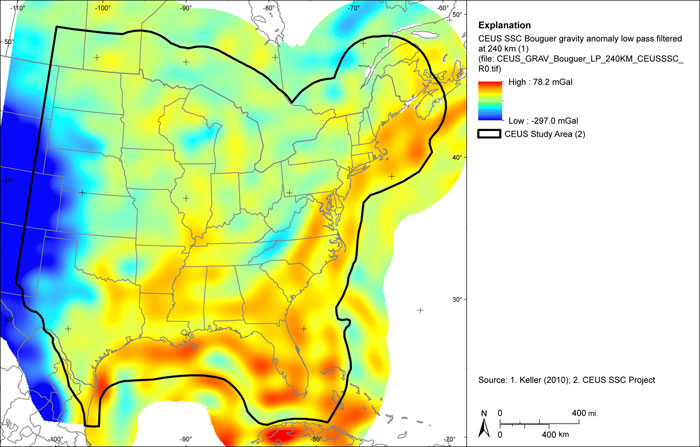
Figure A-26
CEUS-SSC complete Bouguer (with marine free-air) gravity anomaly grid high pass filtered at 240 km. Shaded relief with 315-degree azimuth and 30-degree inclination applied
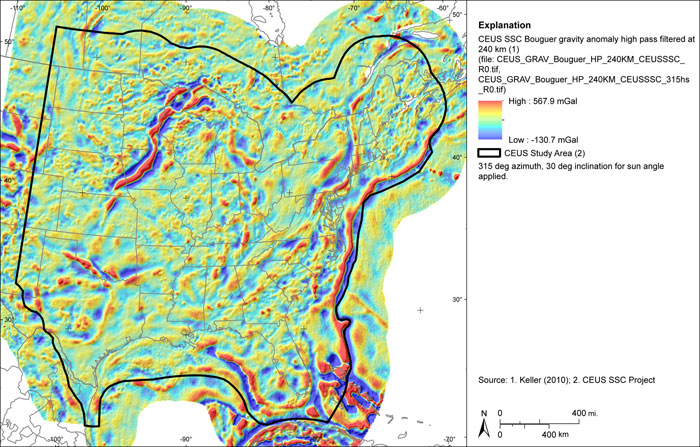
Figure A-27
CEUS-SSC complete Bouguer (with marine free-air) gravity anomaly grid high pass filtered at 240 km. Shaded relief with 180-degree azimuth and 30-degree inclination applied

Figure A-28
CEUS-SSC complete Bouguer (with marine free-air) gravity anomaly grid high pass filtered at 120 km. Shaded relief with 315-degree azimuth and 30-degree inclination applied
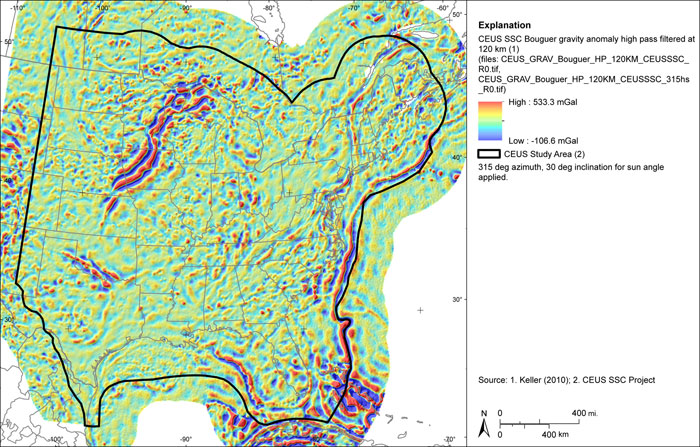
Figure A-29
CEUS-SSC complete Bouguer (with marine free-air) gravity anomaly grid high pass filtered at 120 km. Shaded relief with 180-degree azimuth and 30-degree inclination applied

Figure A-30
CEUS-SSC complete Bouguer (with marine free-air) gravity anomaly grid upward continued to 40 km
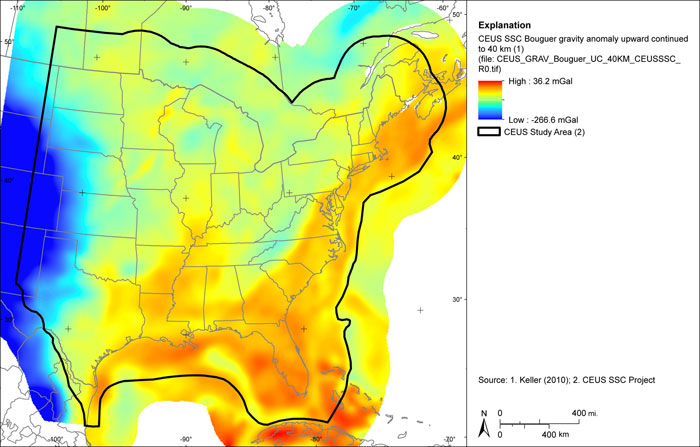
Figure A-31
CEUS-SSC complete Bouguer (with marine free-air) gravity anomaly grid minus the complete Bouguer (with marine free-air) gravity anomaly upward continued to 40 km. Shaded relief with 315-degree azimuth and 30-degree inclination applied

Figure A-32
CEUS-SSC complete Bouguer (with marine free-air) gravity anomaly grid minus the complete Bouguer (with marine free-air) gravity anomaly upward continued to 40 km. Shaded relief with 180-degree azimuth and 30-degree inclination applied
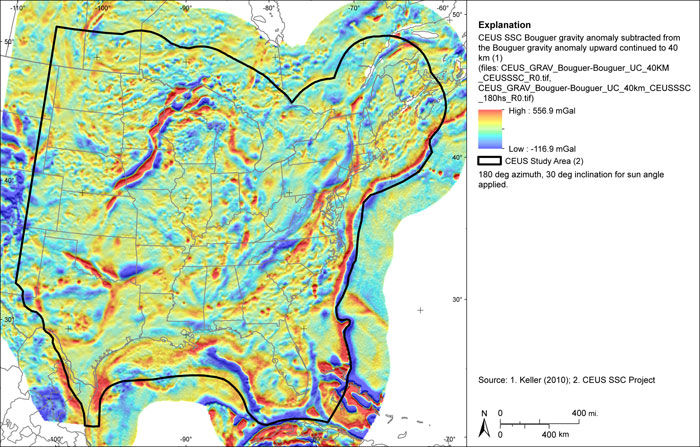
Figure A-33
CEUS-SSC complete Bouguer (with marine free-air) gravity anomaly grid upward continued to 100 km
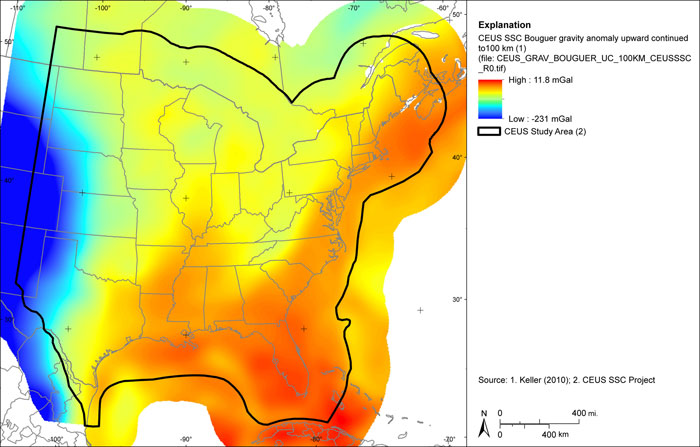
Figure A-34
CEUS-SSC complete Bouguer (with marine free-air) gravity anomaly grid minus the complete Bouguer (with marine free-air) gravity anomaly anomaly upward continued to 100 km. Shaded relief with 315-degree azimuth and 30-degree inclination applied
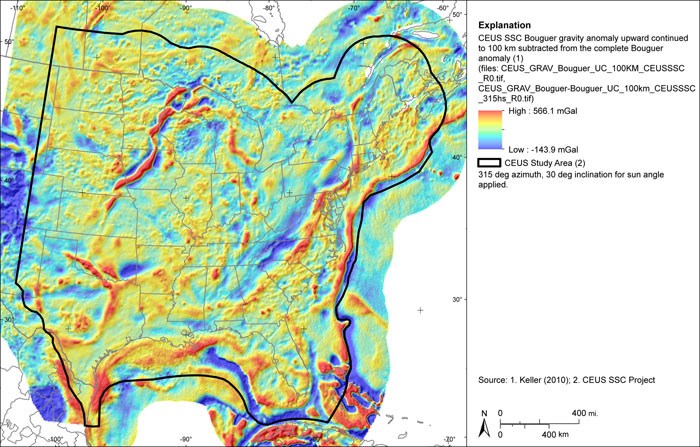
Figure A-35
CEUS-SSC complete Bouguer (with marine free-air) gravity anomaly grid minus the complete Bouguer (with marine free-air) gravity anomaly upward continued to 100 km. Shaded relief with 180-degree azimuth and 30-degree inclination applied
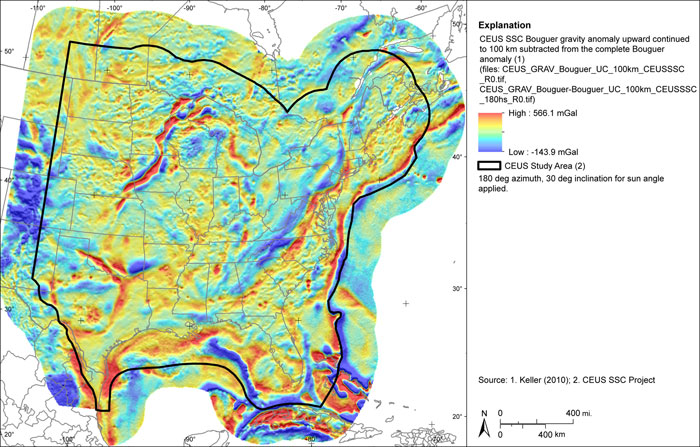
Figure A-36
CEUS-SSC horizontal derivative of residual isostatic gravity anomaly grid
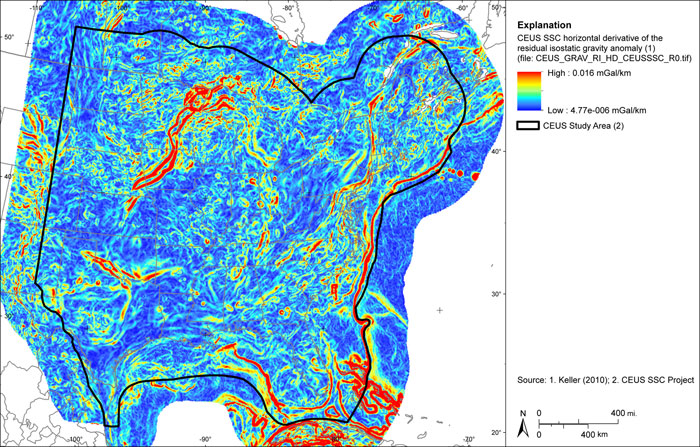
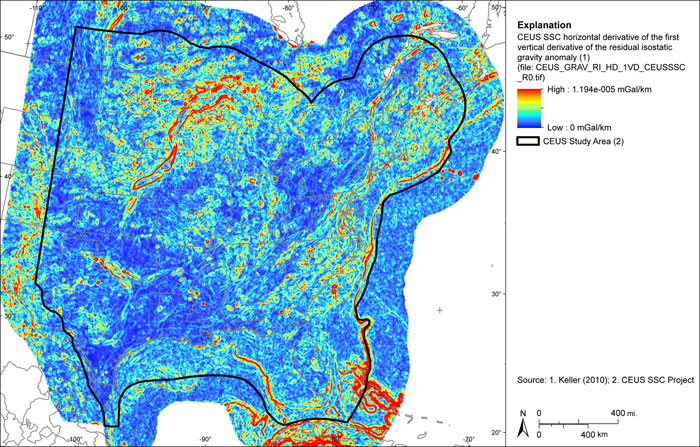
Figure A-37
CEUS-SSC horizontal derivative of first vertical derivative of residual isostatic gravity anomaly grid