Sheet A-17-CEUS-SSC Project GIS Data Summary
Full-Spectrum Magnetic Anomaly Database for the Central and Eastern United States
Download: ![]() Download GIS Data |
Download GIS Data | ![]() Download PDF Figures for Technical Use
Download PDF Figures for Technical Use
Data Files: CEUS_MAG_<varies>_CEUSSSC_R0.tif
Data Description: Data representing magnetic anomaly data in the CEUS. Data layers include:
File Name |
Data Description |
|---|---|
| CEUS_MAG_TMAG_CEUSSSC_R0.tif | Total intensity magnetic anomaly (nT) |
| CEUS_MAG_DRTP_CEUSSSC_R0.tif | Differentially reduced to pole magnetic anomaly data (nT) |
| CEUS_MAG_DEG_DRTP_TDR_CEUSSSC_R0.tif | Tilt derivative of differentially reduced to pole magnetic anomaly (geometric degrees) |
| CEUS_MAG_DRTP_HD_TDR_CEUSSSC_R0.tif | Horizontal derivative of tilt derivative (radians) of differentially reduced to pole magnetic anomaly |
| CEUS_MAG_DRTP_TDR_CEUSSSC_R0.tif | Tilt derivative of differentially reduced to pole magnetic anomaly (radians) |
| CEUS_MAG_TMAG_AAS_CEUSSSC_R0.tif | Amplitude of analytic signal (nT/m) |
Source (Internet URL, CD/DVD-ROM): DVD-ROM provided by D. Ravat, University of Kentucky.
Author/Publisher/Year:
| CEUS_MAG_TMAG_CEUSSSC_R0.tif | Ravat, D., Finn, C., Hill, P., Kucks, R., Phillips, J., Blakely, R., Bouligand, C., Sabaka, T., Elshayat, A., Aref, A., and Elawadi, E., 2009, A Preliminary, Full Spectrum, Magnetic Anomaly Grid of the United States with Improved Long Wavelengths for Studying Continental Dynamics: A Website for Distribution of Data: U.S. Geological Survey, Open-File Report 2009-1258, 2 pp. |
|
CEUS_MAG_DEG_DRTP_TDR_CEUSSSC_R0.tif CEUS_MAG_DRTP_HD_TDR_CEUSSSC_R0.tif |
Ravat, D., 2009, personal communication. |
Data Summary: Digital data in ASCII format was imported into ESRI ArcGIS file geodatabase raster format and exported to TIFF raster format. Data are presented in geographic coordinates on the North American Datum of 1983.
Disclaimer or Constraints on Use: No constraints have been identified.
Figure A-39
CEUS-SSC total intensity magnetic anomaly grid (Ravat et al., 2009). Shaded relief with 315-degree azimuth and 30-degree inclination applied
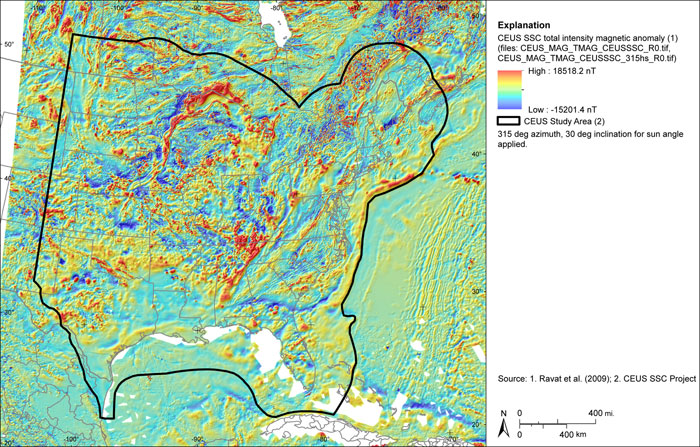
Figure A-40
CEUS-SSC total intensity magnetic anomaly grid (Ravat et al., 2009). Shaded relief with 180-degree azimuth and 30-degree inclination applied

Figure A-41
CEUS-SSC differentially reduced to pole magnetic anomaly grid (Ravat, 2009). Shaded relief with 315-degree azimuth and 30-degree inclination applied
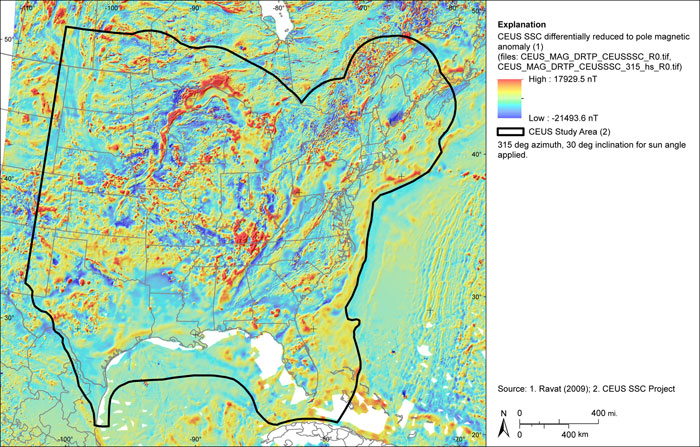
Figure A-42
CEUS-SSC differentially reduced to pole magnetic anomaly grid (Ravat, 2009). Shaded relief with 180-degree azimuth and 30-degree inclination applied

Figure A-43
CEUS-SSC tilt derivative of differentially reduced to pole magnetic anomaly grid (degrees) (Ravat, 2009)
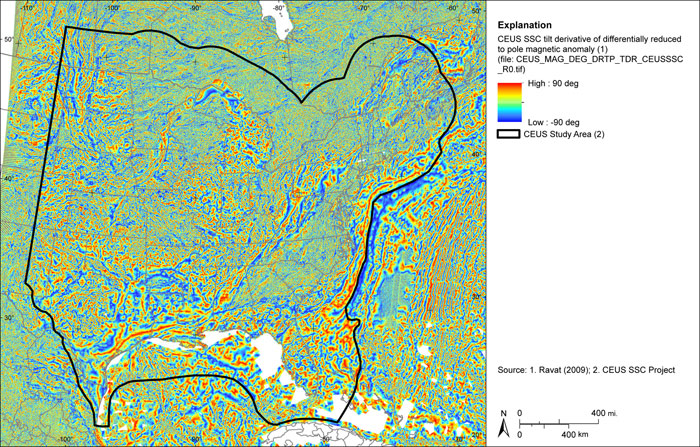
Figure A-44
CEUS-SSC horizontal derivative of tilt derivative of differentially reduced to pole magnetic anomaly grid (radians) (Ravat, 2009)
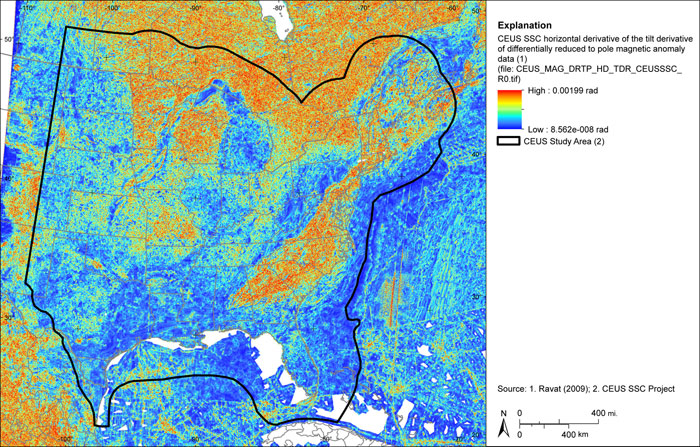
Figure A-45
CEUS-SSC tilt derivative of differentially reduced to pole magnetic anomaly grid (Ravat, 2009)
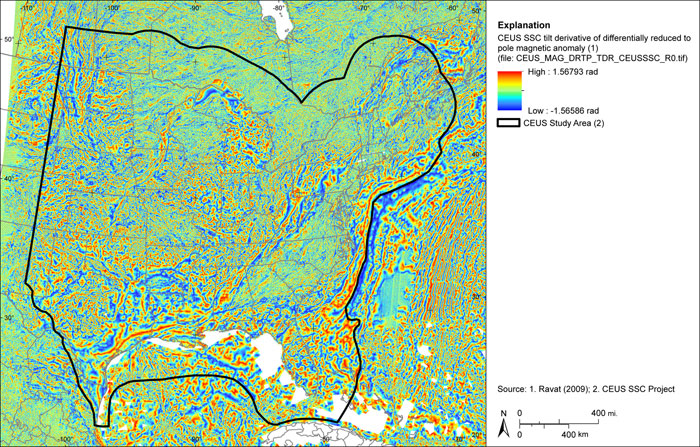
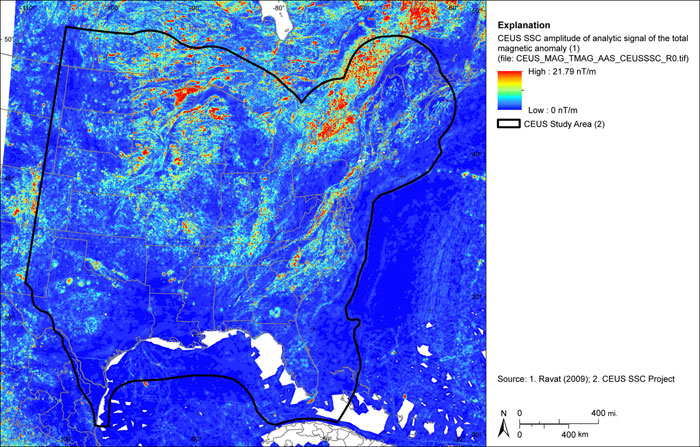
Figure A-46
CEUS-SSC amplitude of analytic signal magnetic anomaly grid (Ravat, 2009)