Sheet A-20-CEUS-SSC Project GIS Data Summary
USGS National Seismic Hazard Maps Seismic Zones-2008
Download: ![]() Download GIS Data |
Download GIS Data | ![]() Download PDF Figures for Technical Use
Download PDF Figures for Technical Use
Data Files:
| eh1hz10pc50.tif | Earthquake hazard: 1 hz 10% in 50 years |
Earthquake hazard: 1 hz 2% in 50 years |
|
Earthquake hazard: 1 hz 5% in 50 years |
|
Earthquake hazard: 3 hz 10% in 50 years |
|
Earthquake hazard: 3 hz 2% in 50 years |
|
Earthquake hazard: 3 hz 5% in 50 years |
|
Earthquake hazard: 5 hz 10% in 50 years |
|
Earthquake hazard: 5 hz 2% in 50 years |
|
Earthquake hazard: 5 hz 5% in 50 years |
|
Earthquake hazard: PGA 10% in 50 years |
|
Earthquake hazard: PGA 2% in 50 years |
|
Earthquake hazard: PGA 5% in 50 years |
Data Description: Uniform background zones, special zones, finite fault sources and hazard probability layers for the CEUS. These zones were defined for U.S. Geological Survey Open-File Report 2008-1128, Documentation for the 2008 Update of the United States National Seismic Hazard Maps. The TIFF-format surfaces present ground motions for various probability levels.
Source (Internet URL, CD/DVD-ROM): ASCII text files provided by Charles Mueller, personal communication, May 2009.
Author/Publisher/Year: Petersen, M.D., Frankel, A.D., Harmsen, S.C., Mueller, C.S., Haller, K.M., Wheeler, R.L., Wesson, R.L., Zeng, Y., Boyd, O.S., Perkins, D.M., Luco, N., Field, E.H., Wills, C.J., and Rukstales, K.S., 2008, Documentation for the 2008 Update of the United States National Seismic Hazard Maps: U.S. Geological Survey Open-File Report 2008-1128, 61 pp.
Data Summary: Data layers were compiled from source ASCII text files of latitude and longitude to define polygon and polyline boundaries. Text files that represent each uniform background zone were merged to create a single polygon GIS layer. Data are presented in geographic coordinates on the North American Datum of 1983.
Disclaimer or Constraints on Use: No constraints have been identified.
Figure A-49
USGS National Seismic Hazard Maps (Petersen et al., 2008)
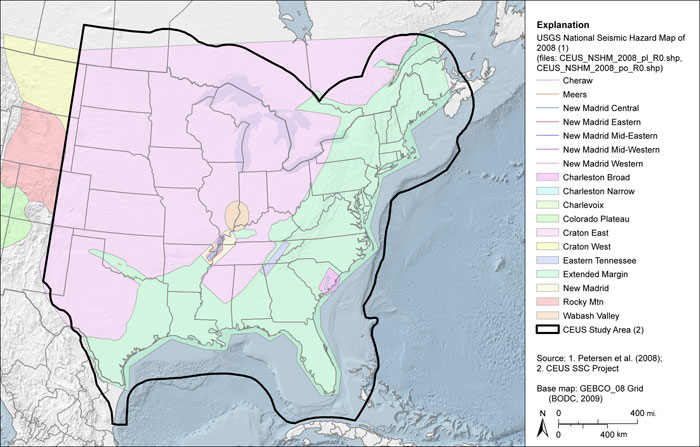
Figure A-50
USGS NSHM ground motion hazard at spectral acceleration of 1 hz with 2% probability of exceedance in 50 years (Petersen et al., 2008)
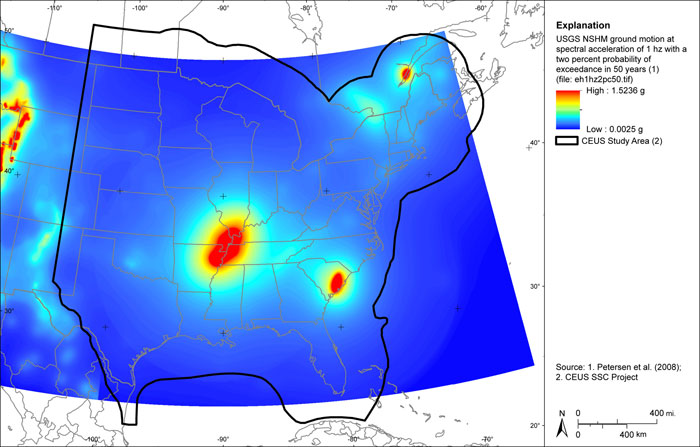
Figure A-51
USGS NSHM ground motion hazard at spectral acceleration of 1 hz with 5% probability of exceedance in 50 years (Petersen et al., 2008)
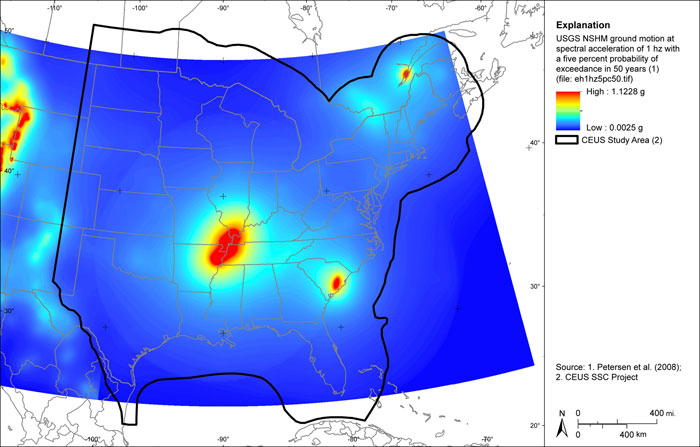
Figure A-52
USGS NSHM ground motion hazard at spectral acceleration of 1 hz with 10% probability of exceedance in 50 years (Petersen et al., 2008)
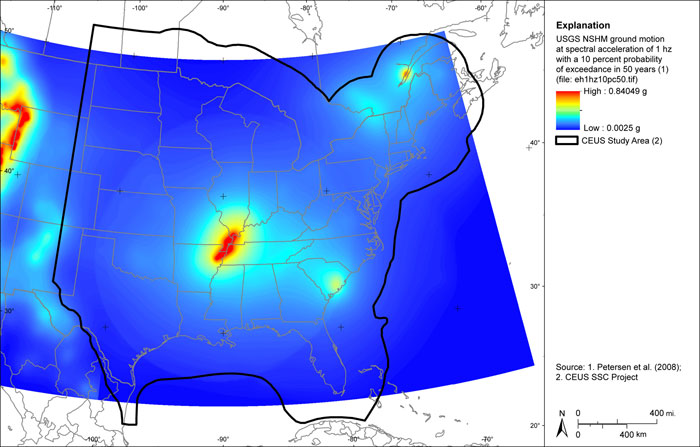
Figure A-53
USGS NSHM ground motion hazard at spectral acceleration of 3 hz with 2% probability of exceedance in 50 years (Petersen et al., 2008)

Figure A-54
USGS NSHM ground motion hazard at spectral acceleration of 3 hz with 5% probability of exceedance in 50 years (Petersen et al., 2008)
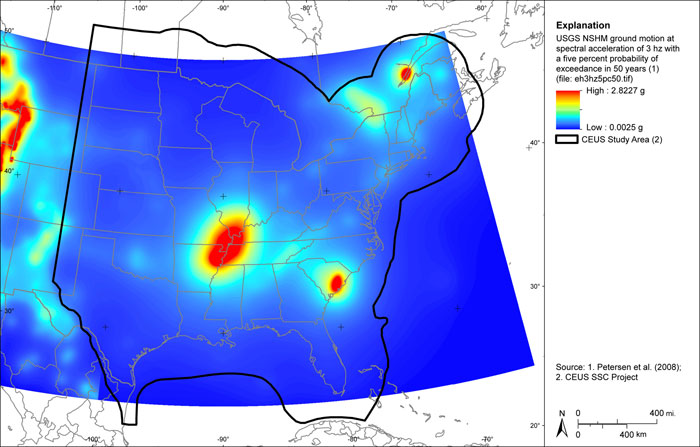
Figure A-55
USGS NSHM ground motion hazard at spectral acceleration of 3 hz with 10% probability of exceedance in 50 years (Petersen et al., 2008)

Figure A-56
USGS NSHM ground motion hazard at spectral acceleration of 5 hz with 2% probability of exceedance in 50 years (Petersen et al., 2008)
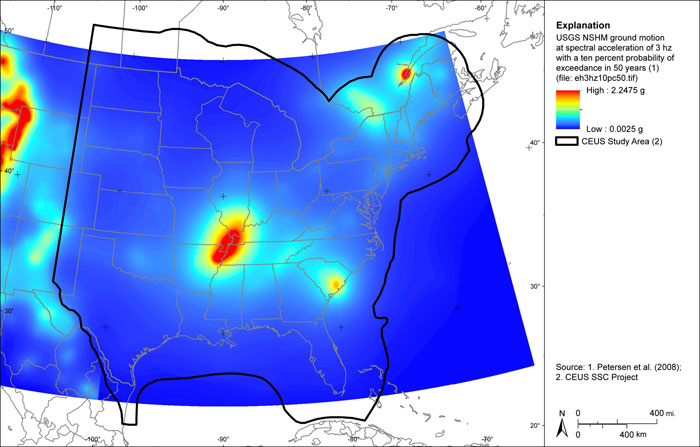
Figure A-57
USGS NSHM ground motion hazard at spectral acceleration of 5 hz with 5% probability of exceedance in 50 years (Petersen et al., 2008)

Figure A-58
USGS NSHM ground motion hazard at spectral acceleration of 5 hz with 10% probability of exceedance in 50 years (Petersen et al., 2008)
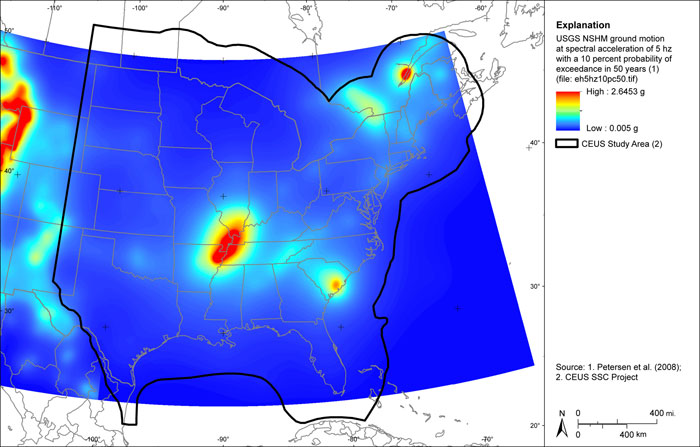
Figure A-59
USGS NSHM peak ground acceleration with 2% probability of exceedance in 50 years (Petersen et al., 2008)
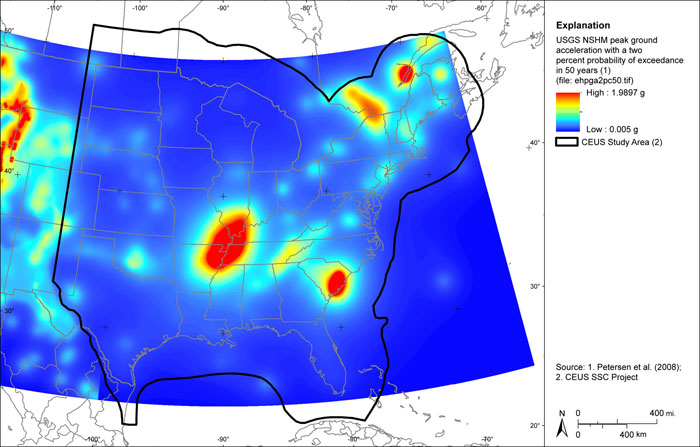
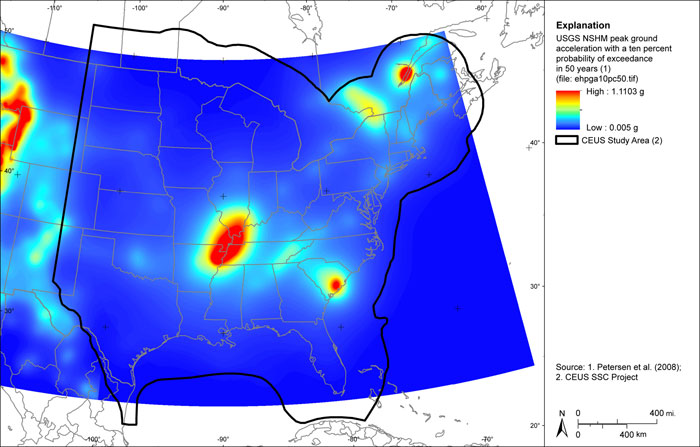
Figure A-60
USGS NSHM peak ground acceleration with 5% probability of exceedance in 50 years (Petersen et al., 2008)

Figure A-61
USGS NSHM peak ground acceleration with 10% probability of exceedance in 50 years (Petersen et al., 2008)