DISCLAIMER OF WARRANTIES AND LIMITATION OF LIABILITIES
THIS DOCUMENT WAS PREPARED BY THE ORGANIZATION(S) NAMED BELOW AS AN ACCOUNT OF WORK SPONSORED OR COSPONSORED BY THE ELECTRIC POWER RESEARCH INSTITUTE, INC. (EPRI). NEITHER EPRI, ANY MEMBER OF EPRI, ANY COSPONSOR, THE ORGANIZATION(S) BELOW, NOR ANY PERSON ACTING ON BEHALF OF ANY OF THEM:
(A) MAKES ANY WARRANTY OR REPRESENTATION WHATSOEVER, EXPRESS OR IMPLIED, (I) WITH RESPECT TO THE USE OF ANY INFORMATION, APPARATUS, METHOD, PROCESS, OR SIMILAR ITEM DISCLOSED IN THIS DOCUMENT, INCLUDING MERCHANTABILITY AND FITNESS FOR A PARTICULAR PURPOSE, OR (II) THAT SUCH USE DOES NOT INFRINGE ON OR INTERFERE WITH PRIVATELY OWNED RIGHTS, INCLUDING ANY PARTY'S INTELLECTUAL PROPERTY, OR (III) THAT THIS DOCUMENT IS SUITABLE TO ANY PARTICULAR USER'S CIRCUMSTANCE; OR
(B) ASSUMES RESPONSIBILITY FOR ANY DAMAGES OR OTHER LIABILITY WHATSOEVER (INCLUDING ANY CONSEQUENTIAL DAMAGES, EVEN IF EPRI OR ANY EPRI REPRESENTATIVE HAS BEEN ADVISED OF THE POSSIBILITY OF SUCH DAMAGES) RESULTING FROM YOUR SELECTION OR USE OF THIS DOCUMENT OR ANY INFORMATION, APPARATUS, METHOD, PROCESS, OR SIMILAR ITEM DISCLOSED IN THIS DOCUMENT.
ORGANIZATIONS THAT PREPARED THIS DOCUMENT
M. Tuttle & Associates
Fugro William Lettis & Associates
CITATIONS
This report was prepared by
M. Tuttle & Associates
128 Tibbetts Lane
Georgetown, ME 04548
Principal Investigator
M.P. Tuttle
Fugro William Lettis & Associates
27220 Turnberry Lane Suite 110
Valencia, CA 91355
Principal Investigator
R.D. Hartleb
This report describes research sponsored by the U.S. Nuclear Regulatory Commission, U.S. Department of Energy (DOE), and Electric Power Research Institute (EPRI).
Drs. Martin Chapman, Russell Green, and Scott Olson, specialists in seismology and geotechnical engineering, reviewed an outline of this document and provided comments and suggestions that were incorporated into the report. Laurel Bauer, Randal Cox, Hanan Mahdi, Stephen Obermeier, Okba Al-Qahdi, Haydar Al-Shukri, Pradeep Talwani, Martitia Tuttle, Roy Van Arsdale, and James Vaughn contributed data to the CEUS paleoliquefaction database. Scott Lindvall assisted with database design and provided overall guidance for the contents of this document. Tanya Broadbent, Jason Finley, Caroline Moseley, David Slayter, and Kathy Tucker assisted with data entry and verification, database management, map development, graphics, and copyright research. Lawrence Salomone, Project Manager for the CEUS-SSC Project, conveyed the importance of this study to industry and government stakeholders, helped to coordinate our efforts, and facilitated communications among the Participatory Peer Review Panel (PPRP), CEUS-SSC Project Team and Sponsors. Thanks to the reviewers whose comments and suggestions enhanced the depth and breadth of this report: TI Team member Stephen McDuffie, members of the PPRP and U.S. NRC staff, and Russell Wheeler of the U.S. Geological Survey.
Introduction
Over the past 30 years, paleoliquefaction studies have contributed to the understanding of the earthquake hazards of various regions in the Central and Eastern United States (CEUS) and southeastern Canada. Paleoliquefaction studies have provided estimates of ages, source areas, magnitudes, and recurrence times of large paleoearthquakes and uncertainties associated with these estimates. Given the need for this information in probabilistic seismic hazard assessment (PSHA), the paleoliquefaction task was undertaken to aid in the development of the seismic source model for the CEUS-SSC Project. Under this task, a new paleoliquefaction database, including regional data sets, was created and this report was prepared, documenting and illustrating the database, discussing uncertainties associated with paleoliquefaction data, and providing guidance on the use of paleoliquefaction data in seismic source characterization.
All large data sets of paleoliquefaction features are included in the CEUS paleoliquefaction database, including those collected in the vicinity of the Charleston seismic zone in eastern South Carolina, the New Madrid seismic zone in southeastern Missouri, northeastern Arkansas, western Tennessee, and western Kentucky, the Wabash Valley seismic zone in southern Illinois and southern Indiana, and the Charlevoix seismic zone in southeastern Quebec (Figure E-1). The paleoliquefaction data compiled for this task are used to estimate recurrence rates and magnitudes of paleoearthquakes, critical seismic source parameters in PSHA and in characterization of seismic source zones for the CEUS-SSC Project.
E.1 Development of the Paleoliquefaction Database
Building on a regional paleoliquefaction database for the New Madrid seismic zone and surrounding region previously developed by M. Tuttle & Associates, the Center for Earthquake Research and Information, and the U.S. Geological Survey, the new CEUS database includes readily available paleoliquefaction data gathered by a diverse group of investigators. The structure of the new database was designed to capture pertinent information for source characterization, as explained below. There are some significant differences between regional data sets in the types of features that have been used to identify paleoearthquakes in the geologic record and in the approaches used to estimate the ages and related uncertainties of paleoliquefaction features. These differences are discussed below for each regional data set.
This section describes the database structure, including definitions of column headings, units of measure, and other relevant information for all data entries. The database itself is available in digital format on the CEUS-SSC Project website. For fields where no data are available or that do not apply, that database entry field is left blank. The following paragraphs describe each data field and provide information on how data was and was not tabulated. Each data field is described individually and in the order in which they appear in the database. Discussions of earthquake-induced liquefaction features as well as various approaches and dating techniques used to estimate the ages of liquefaction features can be found in Sections E.2.1.1, E.2.1.2, and E.2.1.3. Figures E-2 and E-3 are provided to illustrate size parameters of liquefaction features and age data used to estimate preferred ages and related uncertainties of liquefaction features.
KEY: Unique numeric designator of study region for each entry in database. The following ranges are used for the specified priority study areas:
- 1000–1999: Alabama-Louisiana-Mississippi region (ALM)
- 2000–2999: Charleston seismic zone
- 3000–3999: Wabash Valley seismic zone and surrounding region
- 4000–4999: St. Louis, Missouri, region
- 5000–5999: New Madrid seismic zone and surrounding region
- 6000–6999: Marianna, Arkansas, area
- 7000–7999: Newburyport, Massachusetts, and surrounding region
- 8000–8999: Charlevoix seismic zone and surrounding region
- 9000-9999: Atlantic Coast Region and the Central Virginia Seismic Zone
SITE_NAME: Alphabetic designator of study site within study region.
FEAT_ID: Unique alphabetic paleoliquefaction feature identifier that includes shortened version of site name (example: “Bluf-2” indicates paleoliquefaction feature 2 from the Bluffton, South Carolina site).
XCOORD: Numeric value of longitude, in decimal degrees. All values should be negative (“-”). Coordinates of archeological sites rounded to 0.1 decimal degree to protect locations of sites.
YCOORD: Numeric value of latitude, in decimal degrees. All values should be positive. Coordinates of archeological sites rounded to 0.1 decimal degree to protect locations of sites.
COORD_ORIG: Alphabetic description (≤ 254 characters) of positional data for paleoliquefaction feature, including reference shorthand (examples: “digitized from Talwani and Schaeffer (2001) Figure 1” or “unpublished hand-held GPS coordinates from Tuttle”).
OBS_TYPE: Alphabetic description of observation type. Includes: trench, cutbank, aerial photograph, quarry, field mapping, and test pit / auger.
FEAT_TYPE: Alphabetic description of feature type. Includes: sand blow, crater fill, dike, sill, and SSD (for soft sediment deformation structures that are likely earthquake-related).
SSD_DESCR: Alphabetic description (≤ 254 characters) of SSD. This field is used only where “SSD” is entered in the FEAT_TYPE column. Includes description of SSD and assessment of likelihood that it is/is not earthquake-related. Features that are clearly non-earthquake-related are not included in the database.
FEAT_REF: Alphabetic description of citation shorthand for source of FEAT_TYPE information and, where applicable, SSD_DESCR.
SB_THICK, SB_WIDTH, SB_LENGTH, DK_WIDTH, and SILL_THICK: Numeric values of dimensions of sand blow thickness, sand blow width, sand blow length, dike width, and sill thickness, respectively (see Figure E-2). All dimensions are in cm. Because these dimensions typically are from limited trench exposures, values typically are minimum values (with a few exceptions). Additional descriptive information is entered into the COMMENT field(s), as needed.
DIM_REF: Alphabetic description of reference shorthand for dimensional values listed in previous five columns.
C14_MAX: Numeric value of lower bracketing 2-sigma radiocarbon age on feature, in yr BP relative to AD 1950.
C14_MIN: Numeric value of upper bracketing 2-sigma radiocarbon age on feature, in yr BP relative to AD 1950.
C14_REF: Alphabetic description of reference shorthand for radiocarbon data listed in previous two columns.
OSL_MAX: Numeric value of lower bracketing 2-sigma optically stimulated luminescence (OSL) age on feature, in yr BP relative to AD 1950.
OSL_MIN: Numeric value of upper bracketing 2-sigma OSL age on feature, in yr BP relative to AD 1950.
OSL_REF: Alphabetic description of reference shorthand for OSL data listed in previous two columns.
PREFAGEEST: Numeric value of preferred age estimate. In most cases, this will simply be the average or value midway between either: (1)
C14_MAX and C14_MIN; and/or (2) OSL_MAX and OSL_MIN, in yr BP (see Figure E-3). However, in special circumstances, this value may represent a researcher’s preferred age estimate, taking into account specific archeological, stratigraphic, or other criteria. Additional descriptive information is entered into the COMMENT field(s), as needed.
PREFAGEUNP: Numeric value of the upper bound of the preferred age estimate. This value represents the “+” portion of the 2-sigma “±” uncertainty value associated with the PREFAGEEST value.
- In most cases this value will be symmetric about the PREFAGEEST value. In other words, a preferred age estimate of 600 ± 200 yr BP is entered into the database as follows: “600” in PREFAGEEST field, “200” in the PREFAGEUNP field, and “200” in the PREFAGEUNM field.
- In some cases, the uncertainty will be asymmetric about the PREFAGEEST (e.g., 600 +200/150 yr BP). If so, “600” will appear in the PREFAGEEST field, “200” in the PREFAGEUNP field, and “150” in the PREFAGEUNM field (described below).
PREFAGEUNM: Numeric value of the lower bound of the preferred age estimate. This value represents the “-” portion of the 2-sigma “±” uncertainty value associated with the PREFAGEEST value. See above.
PREFAGEREF: Alphabetic description of reference shorthand for preferred age and preferred age uncertainty data listed in previous three columns.
STRAT: Alphabetic description of qualitative age data from stratigraphic relationships, if any. Also includes reference shorthand information.
ARCHEO: Alphabetic description of archaeological age data, if any. Also includes reference shorthand information.
WEATHERING: Alphabetic description of degree of weathering of feature (not weathering of surrounding sediments), if available. Also includes reference shorthand information.
GEOTEC: Alphabetic description of availability of geotechnical information describing paleoliquefaction feature. “Local” or “regional” indicate the type of geotechnical data available for the feature or site.
GEOTEC_REF: Alphabetic description of reference shorthand for geotechnical data listed in previous column.
COMMENT: Alphabetic description of other relevant data not captured in other fields. Note: if > 254 characters required, comments continued in COMMENT2 and COMMENT3 fields, as needed.
All large data sets of paleoliquefaction features in the CEUS and southeastern Canada that have been described in published articles are included in the project paleoliquefaction database (Figure E-1). Summaries of regional data sets are provided below, including overviews of paleoliquefaction studies, descriptions of date types and age estimates, and recommendations for future research. In addition, maps were generated with the geographical information system (GIS) ArcGIS to illustrate the regional data sets and to show geographical and geological features mentioned in the text.
There are some significant differences between data sets, including the types of liquefaction features used to identify paleoearthquakes, information gathered about those features (e.g., their dimensions), basis of age estimates of the features, and overall quality of the data. A summary of the differences in the regional data sets is presented in Table E-1.2.-1. Additional information about the specific types of liquefaction features and their prevalence in the various regions is summarized in Table E-1.2-2. To try to maintain consistency between data sets, we adopted well-established criteria that features must meet to be accepted as earthquake-induced liquefaction features and to be used in seismic source characterization. These criteria include the following (Obermeier, 1996; Tuttle, 2001):
- sedimentary characteristics consistent with case histories of earthquake-induced liquefaction;
- sedimentary characteristics indicative of sudden, strong, upwardly directed hydraulic force of short duration;
- occurrence of more than one type of liquefaction feature and of similar features at multiple locations;
- occurrence in geomorphic settings where hydraulic conditions described in (2) would not develop under nonseismic conditions; and
- age data to support both contemporaneous and episodic formation of features over a large area.
Table E-1.2-1.
Summary of Information on Liquefaction Features in Regional Data Sets
| Regional Data Set1 | Type2 | Age Estimate4 | ArchData5 | SoilsData6 | GeotechData7 | Quality8 | ||||
|---|---|---|---|---|---|---|---|---|---|---|
| SB | SD | SS | Size3 | Num | Infer | |||||
| NMSZ | + |
+ |
– |
+ |
+ |
– |
√ |
+ |
√ |
1 |
| Marianna | + |
+ |
– |
+ |
+ |
+ |
√ |
2 |
||
| St. Louis | – |
+ |
√ |
+ |
√ |
– |
– |
+ |
√ |
2 |
| WVSZ | + |
– |
– |
+ |
– |
– |
√ |
3 |
||
| ALM | – |
√ |
4 |
|||||||
| CSZ | + |
– |
+ |
– |
√ |
2 |
||||
| AC–CVA | √ |
3 |
||||||||
| NEWBURY | – |
+ |
√ |
– |
– |
3 |
||||
| CxSZ | √ |
+ |
– |
+ |
√ |
– |
+ |
√ |
2 |
|
- NMSZ = New Madrid seismic zone and surrounding region; WVSZ = Wabash Valley seismic zone and surrounding region; ALM = Arkansas-Louisiana-Mississippi region; CSZ = Charleston seismic zone; AC-CVA = Atlantic Coast and Central Virginia reconnaissance; NEWBURY = Newburyport, Massachusetts, and surrounding region; CxSZ = Charlevoix seismic zone and surrounding region (includes information of features that formed during 1988 Saguenay earthquake).
- SB = sand blow; SD = sand dike; SS = other soft-sediment deformation structures (see Section E.2.1.1 and Glossary); + = many features; √ = some features; – = few features; blank = no features.
- Size = measured dimension of liquefaction features provided; + = many features; √ = some features; – = few features; blank = no features.
- Num = numerical, based on radiocarbon and or OSL dating; Infer = inferred, based on weathering characteristics and/or stratigraphic position.
- Arch Data= archeological data helps to estimate age of liquefaction features.
- Soils Data = information on soil and/or weathering characteristics of liquefaction features.
- Geotech Data = geotechnical data used to assess liquefaction susceptibility of sediments and/or to estimate magnitude of paleoearthquake.
- Quality = overall quality of data set based on feature type meeting identification criteria, availability of information on feature size, and age estimates based primarily on numerical minimum and maximum constraints; 1 = high quality; 2 = good quality; 3 = fair quality; 4 = low quality.
In addition, we identified sedimentary characteristics consistent with these criteria to facilitate the evaluation of regional data sets. These characteristics are based on studies of modern and historical earthquake-induced liquefaction features and are discussed in more detail in Section E.2 of this appendix (see Figure E-2). Sedimentary characteristics of earthquake-induced liquefaction features include the following:
- Sand blows or sand-blow craters (with feeder dikes)
o Typically elliptical or linear, sometimes circular, in plan view
o Connected to feeder dikes below
o Often characterized by “cut-and-fill” structure and flow structures, and/or lineations, above the feeder dike
o Vented sediment typically fine to coarse sand, may include some silt and clay
o Often becomes finer-grained upsection and laterally away from feeder dike/vent
o Usually thins laterally away from feeder dike/vent
o May comprise multiple fining-up depositional units related to a sequence of earthquakes; seismites may be separated by layers of fines such as silty clay or clay that accumulated between earthquakes
o May contain clasts of host deposit, especially near feeder dike, clast size generally decreases with distance from vent
o Volume of vented deposit should “make sense” relative to size and number of sand dikes
o Subsidence structures may be seen near vent, including localized downwarping of surface soil and host strata and possible vertical displacement across feeder dikes
o Sand-blow craters often form in organic-rich soils or clay-rich host deposits
o Sand-blow craters contain vented sand deposits and clasts of host material; overlain by crater fill deposits and/or reworked material
- Sand dikes
o Dike sidewalls typically subparallel, usually widen downward; also may broaden upward into vent structure at the ground surface (event horizon)
o Typically a few meters to tens of meters long (in plan view); therefore, often, but not always, exposed in both walls of a trench
o Sand within dikes often fines upward
o Often characterized by flow structure or lineations
o Often contain clasts of host deposit(s)
o Near-vertical dikes may exhibit grading, with finer material along dike margins; inclined dikes may exhibit bedding
o May be characterized by subsidiary dikes and/or sills
o Source layer often lacks original sedimentary structure where fluidized, may exhibit flow structure or lineations as well as soft-sediment deformation structures such as ball-andpillow structures and dish structures (see Glossary and Section E.2.1.1)
There also are significant differences between data sets in the approaches used to estimate the ages of paleoliquefaction features, and in the uncertainty associated with those age estimates. To minimize these differences, preferred age estimates and their associated uncertainty have been calculated for this project from 2-sigma minimum and maximum constraining ages for individual liquefaction features. The preferred age estimate is the average of the minimum and maximum values of the constraining age ranges (see Figure E-3). The uncertainty is the difference between the average and the minimum and maximum values of the constraining age ranges. Since they more closely reflect the ages of the liquefaction features, close minimum and close maximum constraining ages, as well as contemporary ages, are preferred over minimum and maximum constraining ages in calculating age estimates. In some cases, additional information provided by archeological or stratigraphic context or by soil development in the liquefaction feature itself is used to help to estimate feature age. Differences in feature types and approaches used to estimate ages of paleoliquefaction features are discussed below in the summaries for each regional data set.
Table E-1.2-2
Summary of Type and Prevalence of Paleoliquefaction Features
| Feature Type1 | Prevalence2 of Paleoliquefaction Features in Regions3 | Selected References4 | ||||||||
|---|---|---|---|---|---|---|---|---|---|---|
| NMSZ | MAR | STL | WVSZ | ALM | CSZ | AC-CVA | NBY | CxSZ | ||
| Sand blow | + |
+ |
- |
√ |
- |
√ |
(a) (b) (c) (d) (e) (f) (g) (h) (i) (j) (k) (l) (m) | |||
| Sand-blow crater |
√ |
+ |
- |
(a) (n) (o) (p) (q) | ||||||
| Sand dike | + |
+ |
+ |
+ |
- |
√ |
- |
√ |
+ |
(b) (e) (g) (n) (p) (r) (s) (t) (u) (v) (w) (x) (y) (z) |
| Sand sill | √ |
- |
√ |
- |
- |
(d) (e) (f) (g) (j) (r) | ||||
| Ball-and-pillow structure | - |
(f) (g) | ||||||||
| Basal erosion and sand diapirs | - |
- |
- |
- |
(f) (g) (z) | |||||
| Dish structure |
- |
- |
(f) (g) | |||||||
| Load casts |
- |
- |
(f) (g) (z | |||||||
| Pseudo-nodules |
- |
- |
- |
(f) (g) (z) | ||||||
- See Section E.2.1.1 and Glossary.
- Prevalence of liquefaction features: + = many features; √ = some features; - = few features; blank = no features.
- NMSZ = New Madrid seismic zone and surrounding region; MAR = Marianna Area; STL = St. Louis and surrounding region; WVSZ = Wabash Valley seismic zone and surrounding region; ALM = Arkansas-Louisiana-Mississippi region; CSZ = Charleston seismic zone; AC-CVA = Atlantic Coast and Central Virginia reconnaissance; NBY = Newburyport, Massachusetts, and surrounding region; CxSZ = Charlevoix seismic zone and surrounding region.
- Selected references shown here (also see paleoliquefaction database and reference lists at the end of this report). (a) Amick, 1990; (b) Tuttle et al., 1990; (c) Saucier, 1991; (d) Hajic et al., 1995; (e) Munson and Munson, 1996; (f) Tuttle, 1999; (g) Tuttle, Chester, et al., 1999; (h) Tuttle, Schweig, et al., 2002; (i) Tuttle et al., 2005; (j) Al-Shukri et al., 2005; (k) Tuttle et al., 2006; (l) Wolf et al., 2006; (m) Talwani et al., 2008; (n) Tuttle et al., 1992; (o) Talwani et al., 1993; (p) Noller and Forman, 1998; (q) Talwani and Schaeffer, 2001; (r) Tuttle and Seeber, 1991; (s) Obermeier et al., 1991; (t) Obermeier et al., 1993; (u) Munson et al., 1995; (v) McNulty and Obermeier, 1999; (w) Broughton et al., 2001; (x) Cox, Larsen, et al., 2004; (y) Exelon, 2003, 2004; (z) Tuttle and Atkinson, 2010.
E.1.2.1 New Madrid Seismic Zone and Surrounding Region
E.1.2.1.1 Overview
In 1811-1812, a major earthquake sequence including three main shocks with moment magnitudes, M 7 to 8, and several large aftershocks, struck the central United States (Figures E-4 through E-12; e.g., Johnston, 1996c; Hough et al., 2000; Bakun and Hooper, 2004). These earthquakes are inferred to have been centered in the New Madrid seismic zone (NMSZ) and to include some of the largest known intraplate earthquakes in the world (Johnston and Kanter, 1990). The large liquefaction field produced by the 1811-1812 main shocks, including liquefaction more than 240 km from their inferred epicenters, supports the interpretation that they were very large-magnitude earthquakes (Fuller, 1912; Ambraseys, 1988; Johnston and Schweig, 1996; Tuttle, Schweig, et al., 2002; Castilla and Audemard, 2007).
During the past 20 years, various investigators have searched for and studied earthquake-induced liquefaction features in the NMSZ and surrounding region (Figures E-4 through E-12). Initially, most liquefaction features were assumed to have formed in 1811-1812; but attention to soil development and relations with cultural horizons and features at archeological sites led to the discovery of pre-1811 sand blows and related sand dikes (Saucier, 1991; Tuttle and Schweig, 1995; Tuttle, Lafferty, Guccione, et al., 1996). Since then, paleoseismic studies have focused on finding and dating paleoliquefaction features, constraining their ages, comparing their internal stratigraphy, size, and spatial distribution to features that formed during the 1811-1812 earthquakes, and estimating the locations, magnitudes, and recurrence times of their causative paleoearthquakes (e.g., Saucier, 1989; Tuttle, Schweig, et al., 2002; Figures E-5 through E-12). Some studies involved investigations of sand blows at archeological sites in the New Madrid seismic zone (e.g., Craven, 1995b; Tuttle et al., 1998, 2000, and 2005), whereas others involved searching for liquefaction features along drainage ditches and river cutbanks across the Mississippi River floodplain and along tributary valleys (Figure E-4; e.g., Vaughn, 1994; Li et al., 1998; Tuttle, 1999; Broughton et al., 2001).
The age estimates of liquefaction features across the region cluster around AD 1810 ± 130 years, AD 900 ± 100 years, AD 1450 ± 150 years, and 2350 BC ± 200 yr and were interpreted to be the dates of causative earthquakes (Figure E-7; Tuttle, Schweig, et al., 2002; Tuttle et al., 2005; Guccione, 2005). Other Holocene paleoliquefaction features have been documented across the region, suggesting additional paleoearthquakes, but the ages of these features are poorly constrained or do not correlate temporally with one another making interpretation difficult. One of these sand blows is similar in age to a “channel straightening” event of the Mississippi River attributed to reverse faulting on the Reelfoot thrust between 2,750 and 3,250 yr BP (Holbrook et al., 2006). In addition, several Late Wisconsin sand blows and dikes have been found in the Western Lowlands (Vaughn, 1994) and in western Kentucky (Tuttle, 2005a; see Figure E-7).
The size, compound nature, and spatial distributions of sand blows that formed circa AD 900 ± 100 years and AD 1450 ± 150 years were found to be strikingly similar to those that formed in 1811-1812 (Figures E-9 and E-12; Tuttle, 1999; Tuttle, Schweig, et al., 2002). The similarity between the historical and prehistoric liquefaction fields suggested that the paleoearthquakes were generated by the same source and had similar magnitudes, M 7 to 8, to the main shocks of the 1811-1812 sequence. These magnitude estimates were supported by several studies that conducted liquefaction potential analysis of geotechnical data collected in different parts of the region (e.g., Schneider and Mayne, 2000; Schneider et al., 2001; Liao et al., 2002; Stark, 2002; Tuttle and Schweig, 2004). Taken together, the paleoliquefaction findings suggested that the NMSZ generated earthquake sequences including very large, M 7 to 8, main shocks every 500 years on average during the past 1,200 years (Tuttle, 1999; Tuttle, Schweig, et al., 2002).
E.1.2.1.2 Data Description
Paleoliquefaction data sets were contributed by the foremost researchers in the New Madrid region including M. Tuttle, J. Vaughn, R. Van Arsdale, R. Cox, and their collaborators and compiled in the CEUS-SSC Project paleoliquefaction database. Additional paleoliquefaction data are drawn from journal articles, technical reports, and graduate student theses. All the data were previously published as indicated in the paleoliquefaction database. For this project, Tuttle, Vaughn, and Van Arsdale identified river sections searched by them and their collaborators, which allowed us to produce Figure E-4. All data were reviewed, 2-sigma minimum and maximum constraining ages entered, and preferred age estimates reassessed. Most of the radiocarbon ages were determined by Beta Analytic Radiocarbon Laboratory and calibrated using the Pretoria procedure (Talma and Vogel, 1993; Vogel et al., 1993). High precision radiocarbon ages were determined for several sub samples by the University of Washington Quaternary Isotope Laboratory. The results compared favorably to those of Beta Analytic. In addition, several calibrated dates provided by Beta Analytic were checked with the calibration program CALIB (Stuiver and Reimer, 1993; Stuiver et al., 2005). This exercise also produced similar results.
For most liquefaction features, preferred age estimates and related uncertainties are calculated from minimum and maximum constraining ages (Figure E-3). The constraining ages are usually 2-sigma calibrated radiocarbon dates, but in a few cases they are optically simulated luminescence (OSL) dates. For a few liquefaction features with only minimum or maximum age constraints and with other information that can help assess the feature’s age (e.g., archeological horizons and features, soil development, and stratigraphic position), preferred age estimates have been assigned. In a few other cases, preferred age estimates and uncertainties have been calculated from close maximum radiocarbon dates. In these instances, the preferred age estimate is the average of the range of the 2-sigma calibrated date and the uncertainty is the difference between the average and the maximum and minimum values of the range. For features with neither minimum nor maximum constraining ages, no preferred age estimate is assigned, unless there are constraining ages for a similar feature in the same stratigraphic position at a nearby site. The paleoliquefaction data in this data set form the basis of the CEUS-SSC Project analyses of the timing, location, and magnitude of paleoearthquakes that induced liquefaction in the NMSZ.
Although a great effort was made between 1995 and 2005 to understand paleoseismicity in the NMSZ and surrounding region, several important issues remain to be resolved that would improve understanding of the earthquake potential of the most hazardous region on the North American continent east of the Rocky Mountains. These issues include the uncertainty in recurrence times of large earthquakes, sources other than the NMSZ that may be capable of large earthquakes such as the Commerce and Eastern Reelfoot Rift Margin faults (e.g., Baldwin et al., 2006; Cox et al., 2006; Magnani and McIntosh, 2009), and migration of seismicity from one part of the Reelfoot Rift fault system to another (e.g., McBride et al., 2002; Tuttle et al., 2006; AlShukri et al., 2009). Therefore, we recommend the following research to help resolve these issues:
- Additional paleoseismic studies in the NMSZ and surrounding region to improve completeness of the paleoearthquake record for the period 1–4 ka and to extend the earthquake chronology back to 10–20 ka. It would be advantageous to investigate sand blows at archeological sites where there would be a high probability of finding suitable organic material for narrowly constraining the ages of the sand blows and thus their causative earthquakes. At sites where in situ tree stumps are found buried beneath sand blows, dendrochronology may help to precisely date paleoearthquakes with uncertainty of a few months to a few years. In addition, it would be advisable to search for sand blows in Late Wisconsin deposits where there may be a longer and older record of paleoearthquakes. It may be advantageous to use OSL dating of sediments at sites of older liquefaction features where organic samples may not be available for radiocarbon dating. Information gained through these efforts would help to reduce uncertainties related to recurrence of large earthquakes.
- Additional paleoseismic studies in the vicinity and along other proposed active faults such as the Eastern rift margin and Commerce faults. Evaluate whether or not the ages and sizes of liquefaction features in close proximity to these faults support the hypothesis that the Eastern rift margin and Commerce faults generated repeated large earthquakes during the Late Wisconsin and Holocene. Additional information is needed to constrain the sizes and recurrence of paleoearthquakes produced by these seismic sources.
- Study of the spatial and temporal characteristics of paleoearthquakes across the region to determine if seismicity migrates from one part of the Reelfoot Rift fault system to another, and if so, if it migrates in a systematic way or with a certain periodicity. The results could help to characterize long-term deformation in the Reelfoot Rift region and may have implications for other aulacogens in intraplate settings.
E.1.2.2 Marianna, Arkansas, Area
E.1.2.2.1 Overview
The Marianna area is located at the southwestern end of the Reelfoot Rift and characterized by little to no seismic activity during the instrumental period (Al-Shukri et al., 2005; Figures E-12 and E-13). In the early 2000s, light-colored patches that appeared to represent large sand blows were identified on satellite images and aerial photographs of the Marianna area about 80 km southwest of the southern end of the NMSZ (Al-Shukri et al., 2005; Figure E-12). Several of these features southwest of Marianna were located on the ground, surveyed with ground-penetrating radar (GPR), and excavated (Figures E-13 and E-14). Trench exposures revealed large sand blows and related feeder dikes. No suitable organic samples were collected for radiocarbon dating, but their high degree of weathering suggested that the sand blows were prehistoric in age.
Subsequently, several other sand blows were excavated, including an exceptionally large (approximately 2.45 m thick, 70 m wide, and 230 m long) sand blow that occurred along a northwest-oriented lineament, referred to as the Daytona Beach lineament (Figures E-13 and E-15 through E-21; Al-Shukri et al., 2006; Tuttle et al., 2006). Radiocarbon and OSL dating of the buried soil immediately below the sand blow provided a close maximum age constraint of about 5,500 years for the formation of the sand blow (Figures E-17 and E-19; Tuttle et al., 2006). The sand blow’s large feeder dike had a strike similar to the lineament. Noting that other large sand blows and sand dikes occurred along the Daytona Beach lineament, the researchers proposed that the lineament is the surface expression of an active fault (Figure E-13; Al-Shukri et al., 2006; Tuttle et al., 2006). In addition, a compound sand blow with the uppermost sand blow interbedded with the basal layers of a back swamp deposit was discovered northeast of Marianna during reconnaissance of the St. Francis Ditch. Radiocarbon and OSL dating of the back swamp deposit immediately above the sand blow provided close minimum age constraint of about 6,800 years (Figures E-17 and E-19; Tuttle et al., 2006).
During the past 5 years, numerous sand blows identified on satellite images and aerial photographs of the Marianna area were confirmed in soil pits, trenches, and with GPR surveys that imaged sand dikes below the sand blows (Figures E-14 through E-21; Al-Shukri et al., 2009; Al-Qadhi, 2010). Many of these sand blows occur along the Daytona Beach lineament that was traced for a total of 17 km by conducting GPR surveys (Figure E-13). One of the trenched sand blows along the lineament is composed of two stratigraphically stacked sand blows and several large feeder dikes. A possible fault, similar in strike to the Daytona Beach lineament, crosscuts one of the large feeder dikes and extends into the upper sand blow (Figure E-14, sand blow 2 on trench log). Layering and layer thickness within the upper sand blow varies across the possible fault suggesting lateral displacement. Both sand blows exposed in the trench were weathered, but the lower, smaller sand blow was especially so (Figure E-14, sand blow 1 on trench log). Radiocarbon and OSL dating of the buried soil immediately below the upper sand blow provided close maximum age constraints of about 10 ka and 12 ka, respectively (Al-Shukri et al., 2009). OSL dating of a sample collected from the soil immediately below the smaller lower sand blow indicates that it formed less than 38 ka. The researchers have concluded that there is a 12 k.y., and possibly 38 k.y., long history of strong ground shaking in the vicinity of the Daytona Beach lineament. The length and linear morphology of the Daytona Beach lineament, as well as the observation of a possible fault crosscutting a large sand blow that formed along the lineament, support the interpretation that the lineament is the surface expression of an active fault.
The sand blows in the Marianna area have been attributed to large paleoearthquakes generated by a source in the Marianna area, possibly the southwestern extension of the Eastern rift margin fault, or the northwest-oriented White River fault zone (WRFZ), or both (Figure E-13; Tuttle et al., 2006; Al-Shukri et al., 2009). As observed in the NMSZ, compound sand blows are indicative of sequences of large earthquakes resulting from complex fault interaction (Saucier, 1989; Tuttle, 1999). As discussed above, the Daytona Beach lineament, subparallel to the nearby WRFZ, may be the surface expression of an active fault (Tuttle et al., 2006; Al-Shukri et al., 2009). The large size of the Marianna sand blows and their spatial association with local faults suggest that the causative earthquakes were centered near Marianna (Figures E-13 and E-18 through E-21). The sand blows are thought not to be distant liquefaction features produced by a large New Madrid earthquake. The ages of the Marianna sand blows do not correlate with events in the New Madrid paleoearthquake chronology and no sand blow has yet been found in the Marianna area that is less than 5,000 years old and could have formed during the historical or prehistoric New Madrid earthquakes.
The investigators noted that a few liquefaction features have been found elsewhere in the Mississippi embayment that are similar in age (approximately 5,500 years) but smaller in size than some of the Marianna sand blows (Tuttle et al., 2006; Tuttle, 2010). These include a sand blow and related feeder dikes near Marked Tree, Arkansas, about 80 km northeast of Marianna (Figure E-12). According to empirical relations between earthquake magnitude and distance to surface manifestation of liquefaction (i.e., sand blows; Ambraseys, 1988; Castilla and Audemard, 2007), a M ~6.6 earthquake could produce sand blows up to 80 km from its epicenter. Therefore, a large earthquake centered near Marianna might be responsible for the 5,500-year-old liquefaction features near Marked Tree (Tuttle, 2010).
E.1.2.2.2 Data Description
Paleoliquefaction data were contributed by H. Mahdi, O. Al-Qahdi, H. Al-Shukri, and M. Tuttle for the Marianna, Arkansas, area and compiled in the CEUS-SSC Project paleoliquefaction database. Most of the data were previously published in journal articles, technical reports, and graduate student theses as indicated in the paleoliquefaction database. For this project, all the data were reviewed, 2-sigma minimum and maximum constraining ages entered, and preferred age estimates calculated. All of the radiocarbon ages were determined by Beta Analytic Radiocarbon Laboratory and calibrated using the Pretoria procedure (Talma and Vogel, 1993; Vogel et al., 1993).
In the Marianna area, most of the samples used in radiocarbon and OSL dating were collected from buried soil immediately below sand blows and provide close maximum age constraint (see Figure E-3). A few samples were collected above sand blows and provide close minimum age constraint. Constraining ages are derived from 2-sigma calibrated radiocarbon dates and from a few OSL dates. In calculating preferred age estimates, radiocarbon dates are given preference over OSL dates since the radiocarbon dates have smaller uncertainties. In most cases, preferred age estimates and related uncertainties of liquefaction features have been calculated from either close maximum or close minimum radiocarbon dates, not both. The preferred age estimate is the average of the range of the 2-sigma calibrated date and the uncertainty is the difference between the average and the end members of the range. No preferred age estimate is assigned to features that have neither close minimum nor close maximum constraining ages. The paleoliquefaction data in this data set form the basis of the CEUS-SSC Project analyses of the timing, location, and magnitude of paleoearthquakes that induced liquefaction in the Marianna area.
E.1.2.2.3 Recommendations
Paleoseismic studies have been conducted in the Marianna area over the past 10 years but have been limited in scope. Most of the work has been concentrated along the northwest-oriented Daytona Beach lineament (Figure E-13). The compound nature of some of the sand blows suggests that multiple faults may rupture in a short period of time to produce earthquake sequences much like the NMSZ. Clearly, there is still much more to be learned in the Marianna area regarding the timing, location, and magnitude of paleoearthquakes that would help to improve the earthquake source model at the southern end of the Reelfoot Rift. To these ends, we recommend the following research:
- Additional paleoseismic investigations of sand blows in the Marianna area including those spatially associated with the northwest-oriented lineament and the northeast-oriented extension of the Eastern Rift fault and other sand blows not associated with any lineament or fault trend. It may be necessary to use OSL dating of sediments buried by sand blows at sites of older liquefaction features where organic samples are not available for radiocarbon dating.
- Additional reconnaissance for and investigation of liquefaction features in the region surrounding Marianna. More information on the ages, size, and spatial distribution of sand blows will help to constrain the timing, locations, and magnitudes of the paleoearthquakes in
the region.
- Liquefaction potential analysis of geotechnical data already collected by the USGS and the Arkansas State Highway and Transportation Department to help assess the magnitudes of the paleoearthquakes in the Marianna area.
- Further development of an earthquake chronology for the Marianna area and comparison of the chronology with that for the NMSZ and with the fault displacement history of the Eastern rift margin fault in western Tennessee.
- Geophysical investigations to determine if the Daytona Beach lineament is underlain by a fault and to help assess its long-term displacement history.
E.1.2.3.1 Overview
In contrast to the NMSZ about 200 km to the south-southeast, the St. Louis region is characterized by low to moderate seismic activity (Figures E-4 and E-22; Nuttli and Brill, 1981; Johnston and Schweig, 1996). A diffuse concentration of seismicity extends northwest from the NMSZ to St. Louis. Seismicity in this region often is attributed to reactivation of old basement faults and earthquake epicenters are spatially associated with the St. Louis fault (Harrison, 1997) and the Centralia fault zone (Mitchell et al., 1991). Over the last 20 years, however, seismicity has not been directly related to any mapped basement structures.
Since the initial discovery of sand dikes along the Kaskaskia River east of St. Louis, paleoseismology studies have documented scores of liquefaction features along rivers in southwestern Illinois and southeastern Missouri (Figures E-22 through E-30; Hajic et al., 1995; McNulty and Obermeier, 1997, 1999; Tuttle, Lafferty, Chester, et al., 1996; Tuttle, Chester, et al., 1999; Tuttle et al., 2004; see also Figures E-31 through 33 and Section E.1.2.4). There are at least two generations of liquefaction features that are Holocene in age. Some of the features are young and probably formed during the 1811-1812 New Madrid earthquakes, known to have induced liquefaction near Cahokia, Illinois. Other features are middle Holocene in age and probably formed during an earthquake about 6,470 yr BP ± 160 yr (Figures E-24, E-25, E-27, and E-30; Tuttle, Lafferty, Chester, et al., 1999).
McNulty and Obermeier (1997, 1999) attributed the middle Holocene liquefaction features in the Shoal Creek-Kaskaskia River area to a M > 6 earthquake located near the lower portion of Shoal Creek (Figure E-33). The earthquake source area was inferred from the distribution and widths of sand dikes. The magnitude of the earthquake was derived from the relation between earthquake magnitude and maximum epicentral distance to surface evidence of liquefaction (e.g., Ambraseys, 1988). Tuttle et al. (Tuttle, Lafferty, Chester, et al., 1996; Tuttle, Chester, et al., 1999; Tuttle et al., 2004) found liquefaction features, mostly sand dikes and one sand blow, in the St. Louis region along the Big Muddy, Kakaskia, and Marys rivers and Cahokia, Crooked, Mud, Piasa, Shoal, and Silver creeks in Illinois and along the Big and Meramec rivers and Saline Creek in Missouri (Figures E-23 through E-30). The largest dikes occur along Shoal Creek, but fairly large dikes also occur along Cahokia Creek and the Meramec River (Figures E-26 through E-29). The age estimates of many of the sand dikes are poorly constrained and regional correlation problematic (Figure E-30). Various locations and magnitudes of scenario earthquakes were evaluated using liquefaction potential analysis that could explain the observed distribution of liquefaction features (Tuttle, Lafferty, Chester, et al., 1999).
E.1.2.3.2 Data Description
Paleoliquefaction data were contributed by M. Tuttle and collaborators in the St. Louis region and compiled in the CEUS-SSC Project paleoliquefaction database. Most of the data were published in technical reports to the U.S. NRC and U.S. Geological Survey as indicated in the database. Tuttle identified river sections searched by her and collaborators that allowed us to produce Figure E-22. All the data were reviewed, 2-sigma minimum and maximum constraining ages entered, and preferred age estimates calculated. All of the radiocarbon ages were determined by Beta Analytic Radiocarbon Laboratory and calibrated using the Pretoria procedure (Talma and Vogel, 1993; Vogel et al., 1993). Paleoliquefaction data gathered in this region by E. Hajic, S. Obermeier, and collaborators are included in the data set for the Wabash Valley seismic zone (see discussion below).
Paleoseismic data in the St. Louis regional data set are from reconnaissance-level studies. Most of the liquefaction features found in the area are sand dikes (Tables E-1.2-1 and E-1.2-2). The ages of the liquefaction features are poorly constrained, except for a few features that formed during the historic period and about 6,470 yr BP (Figure E-25). Some of the sand dikes are greater than 30 cm in width, suggesting that the paleoearthquake responsible for their formation was located in the St. Louis region (Figures E-19 and E-30). However, given that the 1811-1812 New Madrid earthquakes induced liquefaction near St. Louis and several historical sand dikes have been found in the region, it raises the question whether some of the paleoliquefaction features could have formed during paleoearthquakes generated by the NMSZ. To date, no known New Madrid paleoearthquake occurred circa 6,470 yr BP (Figure E-12). The paleoliquefaction data in this data set contributed to the CEUS-SSC Project analyses of the timing, location, and magnitude of paleoearthquakes that induced liquefaction in the St. Louis region.
E.1.2.3.3 Recommendations
Additional study and dating of liquefaction features in the St. Louis region is needed to better constrain the number and timing of paleoearthquakes and to make regional correlations of similar-age liquefaction features. A more complete picture of the size and spatial distributions of liquefaction features would help to reduce the uncertainty of the location and magnitudes of paleoearthquakes, including the 6,470 yr BP event. Therefore, the following research is recommended:
- Add overlapping portion of Wabash Valley data set to St. Louis data set, reviewing each site to avoid duplication.
- Resurvey portions of the Meramec and Kaskaskia rivers and Shoal and Cahokia creeks, where the largest have been found (Figures E-26, E-28, and E-29), in the hopes of finding additional sand blows and collecting samples above and below the sand blows for radiocarbon and OSL dating. At the same time, try to relocate documented liquefaction sites and collect samples for radiocarbon and OSL dating that would improve age estimates of liquefaction features. These efforts would likely improve estimates of the timing, locations, and magnitudes of paleoearthquakes.
- Study whether the liquefaction features in the Shoal Creek–Kaskaskia River area (Figures E-26, E-28, and E-29) could be due to earthquake characteristics such as directivity of ground motions, Moho bounce, or site amplification of ground motions generated by large New Madrid earthquakes. This effort would likely reduce uncertainties related to the locations and magnitudes of paleoearthquakes.
E.1.2.4 Wabash Valley Seismic Zone and Surrounding Region
E.1.2.4.1 Overview
Numerous small- to moderate-magnitude earthquakes have occurred in the Wabash Valley region of southeastern Illinois and southwestern Indiana in historical time. Paleoliquefaction features identified in the region provide evidence for multiple older, moderate- to large-magnitude earthquakes (e.g., Obermeier et al., 1991, 1993; Hajic et al., 1995; Munson et al., 1995, 1997; Munson and Munson, 1996; Obermeier, 1996, 1998, 2009; and McNulty and Obermeier, 1999; Figures E-31 through E-33). The causative fault or faults for the Wabash Valley paleoearthquakes are not known. The great majority of the paleoliquefaction features in the Wabash Valley region are sand dikes found along actively eroding stream banks, but researchers also have identified sand blows and sand sills. Figure E-31 shows river sections searched for liquefaction features and was produced by digitizing published maps from Munson et al. (1997) and McNulty and Obermeier (1999).
The identification of paleoearthquakes in the Wabash Valley region primarily is based on age estimates of paleoliquefaction features, the regional pattern of paleoliquefaction features (especially dike widths), and geotechnical analyses of liquefaction potential. Researchers interpret from six (Munson and Munson, 1996) to eight (McNulty and Obermeier, 1999) Holocene earthquakes, with at least one more during latest Pleistocene time. Based on overlapping radiocarbon ages and the spatial distribution and widths of dikes, McNulty and Obermeier (1999) correlate paleoliquefaction features between sites to estimate the timing, location, and magnitude of paleoearthquakes in the Wabash Valley region (Figure E-33). Magnitude estimates for the paleoearthquakes range from M 6 to ~7.8 (Pond and Martin, 1997; Obermeier, 1998; McNulty and Obermeier, 1999; Green et al., 2005; Olson et al., 2005b).
Section 6.1.9 of the main report provides detailed discussion of magnitude estimates for the interpreted paleoearthquakes in the Wabash Valley region. The two largest earthquakes inferred from paleoliquefaction data are the Vincennes-Bridgeport and Skelton–Mt. Carmel paleoearthquakes M ~7 to 7.8 Vincennes paleoearthquake occurred at approximately 6,100 ±200 yr BP (Hajic et al., 1995; Munson and Munson, 1996; Munson et al., 1997). The M ~6.3 to 7.3 Skelton paleoearthquake occurred at approximately 12 k.y. 1,000 yr BP (Munson and Munson, 1996; Munson et al., 1997). The energy centers for these two earthquakes are inferred to be located within 25–40 km (15.5–25 mi.) of Vincennes, Indiana (Munson et al., 1997; McNulty and Obermeier, 1999).
E.1.2.4.2 Data Description
Paleoliquefaction data are drawn from published journal articles and reports by the foremost researchers in the Wabash Valley region, including S. Obermeier, P. Munson, and E. Hajic (Hajic et al., 1995; Munson et al., 1995; Munson and Munson, 1996; Obermeier, 1998; McNulty and Obermeier, 1999), as well as from a technical report to the Exelon Generation Company’s Clinton site in central Illinois (Exelon, 2003, 2004). Most of the liquefaction features found in the Wabash Valley area are planar, sand-filled dikes (Tables E-1.2-1 and E-1.2-2) that are vertically to steeply dipping and that widen downward and connect to a sediment source at depth (Obermeier et al., 1991). Apparent widths of these sand dikes were measured in the field, the largest of which is 2.5 m wide (Munson and Munson, 1996). Ages of some of these dikes are estimated from radiocarbon dating of organic-rich materials collected from the sediment crosscut by the sand dikes, with supporting evidence from archeological and stratigraphic context, and the relative degree of soil profile development (Hajic et al., 1995; Munson et al., 1995; Munson and Munson, 1996; Obermeier, 1998; McNulty and Obermeier, 1999). For this regional data set, we did not estimate preferred age estimates of liquefaction features because we did not have the necessary information to do so (e.g., C14 or OSL sample location relative to sand dikes and sand blows). Instead, we entered the investigators’ assigned ages into the database.
E.1.2.4.3 Recommendations
Numerous researchers have studied paleoliquefaction in the Wabash Valley region during the past 20 years, and this research is ongoing. As a result, the Wabash Valley data set is relatively mature. However, we recommend the following as useful topics for future paleoliquefaction research in the Wabash Valley region:
- Re-evaluation of previously collected age data and estimation of preferred age estimates of liquefaction features.
- Additional sampling and age analyses to further refine and reduce uncertainties of age estimates and correlation of paleoliquefaction features between sites, if possible.
- Additional geotechnical testing to provide better estimates for the locations and magnitudes of paleoearthquakes, as recommended by McNulty and Obermeier (1999).
- Additional reconnaissance in the northern part of the Illinois basin where moderate–sized earthquakes are recorded in the instrumental record. Documenting the presence or absence of paleoearthquakes in the northern part of the basin in an area with similar susceptible deposits would help to better evaluate the apparent spatial stationarity of earthquakes in the southern part of the Illinois basin.
E.1.2.5 Arkansas-Louisiana-Mississippi Region
E.1.2.5.1 Overview
Cox and collaborators have conducted studies in southeastern Arkansas, northeastern Louisiana, and western Mississippi areas (ALM) investigating what they interpret to be paleoliquefaction features related to moderate- to large-magnitude earthquakes possibly produced by the Saline River fault zone in southeastern Arkansas (Cox, 2002, 2009; Cox, Harris, et al., 2004; Cox, Larsen, et al., 2004; Cox, Larsen, and Hill, 2004; Cox and Larsen, 2004; Cox and Gordon, 2008; Figure E-34). Many of the features interpreted as earthquake-induced liquefaction features were not reviewed in the field by other geologists with prior experience with such features. The ALM observations and interpretations can be summarized as follows:
- On aerial photographs, Cox and collaborators observed roughly circular light-colored patches throughout the Arkansas and Mississippi River valleys between southeastern Arkansas and northeastern Louisiana and interpreted the patches to be seismically induced sand blows.
- In trenches excavated at seven locations, sandy deposits and crosscutting features were observed and interpreted as sand blows and sand dikes, respectively, and attributed to several episodes of earthquake-induced liquefaction.
- On the basis of similar sedimentary stratigraphy as well as radiocarbon and OSL dating of deposits, Cox and collaborators attributed the features they interpreted as sand blows and sand dikes to several moderate- to large-magnitude earthquakes centered near the Saline River fault zone.
As part of the CEUS-SSC Project, the results of the investigations by Cox and collaborators in the ALM were evaluated to determine if there is either (1) paleoseismic evidence of repeated large-magnitude earthquakes; or (2) evidence for a single large-magnitude Quaternary event that might affect seismic source characterization. As described in Section 7.3.9 (Extended Continental Crust-Gulf Coast, or ECC-GC) of the main CEUS SCC Project report, no evidence was found for repeated large-magnitude earthquakes and little to no evidence was found for large (M > 6) earthquakes during a review of published papers as well as original photographs and logs.
In general, the ALM features did not exhibit sedimentary characteristics typical of earthquake-induced liquefaction features and therefore did not meet the criteria adopted for this project and described above in Section E.1.2. More specifically, the sandy deposits interpreted as sand blows often lacked a clear connection to sand dikes below and rarely appeared to thin and fine laterally away from the main feeder dike. Many of the features interpreted as sand dikes lacked clear margins and lateral continuity and rarely broadened downward. The best candidate for a paleoliquefaction feature comes from the west wall of the Portland, Arkansas, trench, where a possible small (<6 cm wide) dike is shown in logs and photographs at approximately meter 4.5 (Cox, Larsen, et al., 2004). It remains unclear whether this relatively small dike is the result of (1) a moderate-magnitude local earthquake; (2) a larger, more distant earthquake; or (3) non-earthquake processes. Other small sand dikes may occur in other trenches. Please see Section 7.3.9 of the main CEUS SCC Project report for a thorough discussion of the evaluation of the ALM features.
E.1.2.5.2 Data Description
Paleoliquefaction data for the ALM region were contributed by R. Cox and drawn from journal articles and technical reports by Cox and his collaborators. We reviewed the paleoliquefaction data from the ALM region and consider them highly uncertain and the data set relatively immature. These data do not provide evidence for a source of repeated large-magnitude earthquakes in the ALM region. The CEUS paleoliquefaction database includes the locations of seven paleoseismic trenches in the ALM region (Cox, Harris, et al., 2004; Cox, Larsen, et al., 2004; Cox et al., 2007; Figure E-34), with a brief description of the researchers’ interpreted results provided in the COMMENT data field.
E.1.2.5.3 Recommendations
As determined for the CEUS-SSC Project (see Section 7.3.9 of the main report), the paleoliquefaction data from the ALM region are considered highly uncertain and do not provide evidence for a source of repeated large-magnitude earthquakes in the ALM area. We recommend the following as topics for future paleoliquefaction research in the ALM region:
- Additional field work and trenching to evaluate the interpretation that the roughly circular sandy deposits observed in aerial photographs are earthquake-induced sand blows (e.g., Cox, Harris, et al., 2004; Cox, Larsen, et al., 2004; Cox et al., 2007; Cox, 2009) or if they formed by some other means.
- Additional sampling and age analyses to further refine the timing and correlation of any paleoliquefaction features between trench sites and with other areas of paleoliquefaction such as the Marianna area, if possible.
E.1.2.6 Charleston Seismic Zone
E.1.2.6.1 Overview
Strong ground shaking during the 1886 Charleston, South Carolina, earthquake produced extensive liquefaction expressed primarily as sand-blow craters at the ground surface (Dutton, 1889). Liquefaction features from the 1886 event are preserved in geologic deposits at numerous locations in the South Carolina coastal region (e.g., Talwani and Cox, 1985; Amick, 1990; Amick, Gelinas, et al., 1990; Amick, Maurath, and Gelinas, 1990; Amick and Gelinas, 1991; Obermeier et al., 1989, 1990; and Talwani and Schaeffer, 2001; Figures E-35 and E-36). Documentation of sand-blow craters and other paleoliquefaction features throughout coastal South Carolina provides evidence for prior strong ground motions during prehistoric large earthquakes (e.g., Obermeier et al., 1989, 1990; Weems and Obermeier, 1990; Amick, Gelinas, et al., 1990; Amick, Maurath, and Gelinas, 1990; Talwani and Schaeffer, 2001; Talwani et al., 2008; Figures E-35 and E-36). Talwani and Schaeffer (2001) interpret between three and four large-magnitude earthquakes in the past approximately 2,000 years, and between five and seven large-magnitude earthquakes in the past approximately 5,800 years.
As described in more detail in Section E.1.2.7, reconnaissance-level searches for paleoliquefaction features have been conducted along the eastern seaboard (e.g., Amick, Gelinas, et al., 1990; Gelinas et al., 1998; Figure E-37). These studies did not find paleoliquefaction features beyond the Charleston region and suggest a stationary source of repeated, large-magnitude earthquakes located near Charleston.
E.1.2.6.2 Data Description
Data for the Charleston region in the CEUS-SSC study paleoliquefaction database primarily are taken from Talwani and Schaeffer’s (2001) compilation, with additional data from other studies (e.g., Noller and Forman, 1998; Talwani et al., 2008). Most of the age estimates of paleoliquefaction features in coastal South Carolina are based on radiocarbon dating. Noller and Forman (1998) present luminescence age estimates for five samples collected from sand-blow craters exposed at Gapway, South Carolina. However, they emphasize that their reported age estimates are preliminary and “should be used with caution” (Noller and Forman, 1998, pp. 4-56). Therefore, the age estimates of paleoliquefaction features used by the CEUS-SSC Project to constrain the timing of prehistoric earthquakes in the Charleston region are based on radiocarbon analyses. Talwani and Schaeffer (2001) combine radiocarbon ages from previously published sources with their own studies of paleoliquefaction features in the South Carolina coastal region. Their compilation forms the basis of the CEUS-SSC Project analyses of Charleston paleoliquefaction. These data include ages that provide contemporary, minimum, and maximum limiting ages for the formation of paleoliquefaction features.
Talwani and Schaeffer (2001) identify individual earthquake episodes based on samples with a “contemporary” age constraint that have overlapping calibrated radiocarbon ages at approximately 1-sigma confidence interval. The standard in paleoseismology, however, is to use calibrated ages with 2-sigma (95.4 percent confidence interval) error bands (Grant and Sieh, 1994). Likewise, in paleoliquefaction studies, to more accurately reflect the uncertainties in radiocarbon dating and age estimates of paleoliquefaction features, Tuttle (2001) advises the use of calibrated radiocarbon dates with 2-sigma error bands (as opposed to narrower 1-sigma error bands). In recognition of this, the conventional radiocarbon ages presented in Talwani and Schaeffer (2001) are recalibrated and reported with 2-sigma error bands for use in the CEUS-SSC Project. This recalibration was performed with the radiocarbon calibration program OxCal version 4.1 (Bronk Ramsey, 2009) using the calibration curve of Stuiver et al. (1998). The recalibrated 2-sigma radiocarbon ages form the basis of the CEUS-SSC Project analyses of the timing, location, and magnitude of paleoearthquakes that induced liquefaction in the vicinity of Charleston, South Carolina. Section 6.1.2 of the main report provides additional discussion of the earthquake chronology for the Charleston seismic zone, including space-time diagrams and tabulated results.
E.1.2.6.3 Recommendations
Numerous researchers have studied paleoliquefaction in the Charleston region during the past 30+ years, and this research is ongoing. As such, the Charleston data set is relatively mature. However, we recommend the following as useful topics for future paleoliquefaction research in the Charleston region:
- Additional and more detailed documentation of feature size (e.g., dike width, sand-blow deposit thickness). This additional information could be used to further refine locations and magnitude estimates of paleoearthquakes.
- More detailed documentation of areas searched. This additional information could be used to assess the uncertainties associated with paleoearthquake locations and design future studies to improve those locations.
- Additional site-specific and regional geotechnical characterizations, including liquefaction susceptibility and liquefaction potential. This additional information could be used to further refine locations and magnitude estimates of paleoearthquakes.
E.1.2.7 Atlantic Coast Region and the Central Virginia Seismic Zone
Reconnaissance-level searches for paleoliquefaction features were conducted along the eastern seaboard from southernmost Georgia to New Jersey (Amick, Gelinas, et al., 1990) and as far north as New England (e.g., Gelinas et al., 1998; Figure E-37). These studies did not find paleoliquefaction features beyond the Charleston region and suggest a stationary source of repeated, large-magnitude earthquakes located near Charleston.
The Central Virginia seismic zone is an area of persistent, low-level earthquake activity that extends about 120 km in a north-south direction and about 145 km in an east-west direction from Richmond to Lynchburg, Virginia (Bollinger and Sibol, 1985). Seismicity in the Central Virginia seismic zone ranges in depth from about 3 to 13 km (Wheeler and Johnston, 1992). The largest historical earthquake that has occurred in the Central Virginia seismic zone is the December 23, 1875, mb 5.0 Goochland County earthquake (Bollinger and Sibol, 1985). It is difficult to attribute the seismicity to any known geologic structure, and it appears that the seismicity extends both above and below the Appalachian detachment.
Searches for paleoliquefaction features were conducted along several rivers in the vicinity of the Central Virginia seismic zone (Obermeier and McNulty, 1998; Dominion, 2004) (Figure E-38). They identified possible small sand dikes at three sites and interpreted them as paleoliquefaction features resulting from at least one, and possibly as many as three, moderate-magnitude earthquakes during the Holocene. Obermeier and McNulty (1998) conclude that “the paucity of liquefaction features in central Virginia makes it seem unlikely that any earthquake in excess of M ~7 has struck there.”
We recommend that any additional searches for liquefaction features in the Atlantic Coast region and Central Virginia seismic zone include documentation of rivers searched, of the liquefaction features including their sedimentological characteristics and stratigraphic context, and field conditions such as quality of exposures and water levels at the time of reconnaissance.
E.1.2.8 Newburyport, Massachusetts, and the Surrounding Region
E.1.2.8.1 Overview
Northeastern Massachusetts, southeastern New Hampshire, and southernmost Maine have experienced many small, and several moderate to large, earthquakes during the past 400 years (Figure E-39). The two most notable earthquakes, the 1727 felt-area magnitude (Mfa) 5.5 Newburyport and 1755 Mfa 6 Cape Ann events, induced liquefaction and caused damage to buildings (Ebel, 2000, 2001). During a paleoseismology study in the late 1980s, both historical and prehistoric liquefaction features were found in the Newburyport area (Tuttle et al., 1987; Tuttle and Seeber, 1991; Figures E-40 through E-43). This initial study involved interpreting aerial photographs, excavating trenches at locations described in historical accounts of liquefaction, and searching for liquefaction features in exposures provided by sand and gravel pits and excavations for new building foundations.
The historical features were attributed to the 1727 earthquake and the prehistoric features were estimated to have formed during the past 4,000 years. Because the ages of the prehistoric liquefaction features were poorly constrained, the number and timing of paleoearthquakes were not estimated. In addition, the area over which the prehistoric earthquake(s) induced liquefaction was not determined, limiting interpretations of earthquake source area and magnitude. During a subsequent paleoseismic study, searches for earthquake-induced liquefaction features were conducted in marshes, rivers, and bays in northeastern Massachusetts and southeastern New Hampshire (Gelinas et al., 1998; Figure E-39). No additional liquefaction features were found, but sedimentary conditions suitable for the formation of liquefaction features were notably sparse in many of the areas searched. The failure to find additional liquefaction features was interpreted as a lack of evidence for a M > 6 earthquake in the region during the late Holocene (Gelinas et al., 1998).
More recently, searches for earthquake-induced liquefaction features have been conducted along several rivers south of Newburyport, Massachusetts, as well as in the vicinity of Hampton Falls and west of Hampton Falls in New Hampshire (Figure E-39; Tuttle, 2007, 2009). Reconnaissance was performed in areas where ground failure indicative of liquefaction was reported for the 1727 earthquake (Brown, 1990; Coffin, 1845). Surveys were conducted when river levels and tides were low and cutbank exposures were at a maximum. During the surveys, only one liquefaction feature, a small sand dike, was found along the Hampton Falls River in New Hampshire (Figures E-42 and E-43). The upper portion of the sand dike had been eroded and any relation to an overlying sand lens (possibly a sand blow or sand sill) could not be determined. Radiocarbon dating of organics collected adjacent to the uppermost intact portion of the dike provides a maximum constraining age of 2,750 yr BP In addition, a distinctive 2,200-year-old sand layer, that exhibits some characteristics of tsunami deposits, was observed in several marshes along the Massachusetts–New Hampshire coast (Tuttle, 2007, 2009).
E.1.2.8.2 Data Description
Paleoliquefaction data were contributed by M. Tuttle and collaborators for the Newburyport, Massachusetts, region and compiled in the CEUS-SSC Project paleoliquefaction database. Most of the data were published previously in journal articles and technical reports. Sections of rivers searched by Tuttle and collaborators as well as by Gelinas et al. (1998) are shown in Figure E-39. The Newburyport paleoliquefaction data were reviewed, 2-sigma minimum and maximum constraining ages entered, and preferred age estimates calculated. All of the radiocarbon ages were determined by Beta Analytic Radiocarbon Laboratory and calibrated using the Pretoria procedure (Talma and Vogel, 1993; Vogel et al., 1993). All of the liquefaction features dated in the Newburyport region are sand dikes (Tables E-1.2-1 and E-1.2-2). Relations with possible sand blows could not be confirmed. Only maximum constraining ages are available for some of the dikes. Crosscutting relations and weathering characteristics suggest two generations of features, one of which is historical in age. The paleoliquefaction data in this data set contributed to the CEUS-SSC Project analyses of the timing, location, and magnitude of paleoearthquakes in this part of New England.
E.1.2.8.3 Recommendations
Newburyport, Massachusetts, and the surrounding region is a seismically active area relative to the rest of New England. Historically, the largest earthquake to have occurred in the region was the 1775 Mfa ~6 earthquake. Paleoseismic studies have found several liquefaction features in the Newburyport-Hampton Falls area attributed to the 1727 Mfa ~5.5 earthquake and to a paleoearthquake sometime during the past 4,000 years (Figure E-43). The scarcity of liquefaction features may be due to the limited distribution of sandy sediments susceptible to liquefaction at relatively low levels of ground shaking. Also, the lateral and vertical variability of Late Wisconsin deposits in the region makes searching for liquefaction features especially challenging (Tuttle and Seeber, 1991). Significant uncertainties remain regarding the maximum magnitude earthquake and the recurrence rates of earthquakes in this region. Therefore, despite the challenges of working in this region, the following research is recommended to help reduce these uncertainties:
- Broader search for liquefaction features targeting areas where sediments susceptible to liquefaction are present and where exposures are available along river cutbanks.
- Re-excavation of some of the paleoliquefaction sites in Newburyport to better constrain their
ages and to re-evaluate their relationships to possible sand blows.
E.1.2.9 Charlevoix Seismic Zone and the Surrounding Region
E.1.2.9.1 Overview
The Charlevoix seismic zone in Quebec Province of southeastern Canada is one of the most seismically active areas in eastern North America and is spatially associated with Iapetan faults and the Charlevoix impact crater (Figure E-44; e.g., Adams and Basham, 1989; Lamontagne et al., 2000). Charlevoix was the source of three historical earthquakes of M > 6 dating back to the 1660s (e.g., Bent, 1992; Lamontagne et al., 2007; Lamontagne, 2009). Accounts of ground failure during the 1870 and 1925 Charlevoix earthquakes are indicative of liquefaction in the Gouffre River valley (Smith, 1966).
Recently, a paleoseismic study was conducted in the Charlevoix seismic zone and the St. Lawrence Lowlands to the southwest in the Quebec City–Trois Rivières region (Figure E-44; Tuttle and Atkinson, 2010). During the study, river cutbanks were searched for earthquake-induced liquefaction features, including 40 km in the Charlevoix region and 100 km in the Quebec City–Trois Rivières region. In the Charlevoix region, three generations of earthquake-induced liquefaction features that formed during the past 10.2 k.y. were found in Late Wisconsin and Holocene deposits, whereas no liquefaction features were found in the Quebec City–Trois Rivières region despite searching more than twice the river length in similar deposits (Figures E-44 through E-49).
The Charlevoix liquefaction features included sand dikes and soft-sediment deformation structures such as basal erosion and sand diapirs, load casts, pseudonodules, and related folds (Tables E-1.2-1 and E-1.2-2; see Section E.2.1.1). The authors suggested that the liquefaction record of paleoearthquakes is likely to be incomplete for the Holocene due to fluctuating hydrologic conditions related to changes in relative sea level in the St. Lawrence estuary (Tuttle and Atkinson, 2010). Thus three earthquakes large enough to induce liquefaction during the past 10.2 k.y. should be viewed as a minimum. During the study, various magnitudes and locations of earthquakes were evaluated using liquefaction potential analysis. The results indicated that the distribution of liquefaction features could be explained by M > 6.2 earthquake located in the Charlevoix seismic zone (Tuttle and Atkinson, 2010).
In 1988, the M 5.9 Saguenay earthquake occurred north of the Charlevoix seismic zone in the Laurentide Mountains, an area that had been thought to have a low seismic hazard. The 1988 Saguenay earthquake (Somerville et al., 1990; Du Berger et al., 1991) triggered rock falls and landslides and induced liquefaction in Holocene fluvial and Late Wisconsin glaciofluvial and glaciolacustrine deposits (Tuttle et al., 1989, 1990). Liquefaction occurred in the epicentral area and up to 30 km from its epicenter in the Ferland-Boilleau valley (Figures E-45 through E-49). During excavation and documentation of modern sand blows in Ferland, the researchers found evidence for a prior earthquake (Tuttle et al., 1992; Tuttle, 1994). Radiocarbon dating of the paleoliquefaction features indicated that a large earthquake occurred in the region in AD 1420 ± 200 yr. Given the relative size of the two generations of features, the previous event may have been larger or located closer to the Ferland-Boilleau valley than the 1988 earthquake.
E.1.2.9.2 Data Description
Paleoliquefaction data from the Charlevoix seismic zone and the Saguenay region, as well as liquefaction data related to the 1988 Saguenay earthquake, were contributed by M. Tuttle and collaborators to the CEUS-SSC Project paleoliquefaction database. The paleoliquefaction data and information about river sections searched in the Charlevoix seismic zone and the Quebec City–Trois Rivières region were previously published in journal articles and/or technical reports. For this project, a new map was created of the Charlevoix seismic zone and the Quebec City– Trois Rivières region showing mapped structures and river sections along which reconnaissance and systematic searched for liquefaction features were performed (Figure E-44). All Quebec paleoliquefaction data were reviewed, 2-sigma minimum and maximum constraining ages entered, and preferred age estimates calculated. All age estimates of liquefaction features are based on radiocarbon dating, and all radiocarbon ages were determined by Beta Analytic Radiocarbon Laboratory and calibrated using the Pretoria procedure (Talma and Vogel, 1993; Vogel et al., 1993).
In the Charlevoix region, most of the samples used in radiocarbon dating were collected from deposits cut by sand dikes, from animal burrows or root casts that crosscut sand dikes, or from deposits in which soft-sediment deformation structures had formed (Tables E-1.2-1 and E-1.2-2). In the Saguenay region, there was no need to date the sand blows that formed during the 1988 Saguenay earthquake, but paleoliquefaction features, including sand-blow craters, sand blows, and sand dikes were dated with samples that pre- and post-dated them. Constraining ages were derived from 2-sigma calibrated radiocarbon dates, and preferred age estimates and uncertainties were calculated from minimum and maximum constraining ages. In one case, a preferred age estimate and related uncertainty is calculated from a close minimum constraining age. In this case, the preferred age estimate is the mean of the 2-sigma calibrated age range and the uncertainty is the difference between the average and the end values of the range. The paleoliquefaction data in this data set contributed to the CEUS-SSC Project analyses of the timing, location, and magnitude of paleoearthquakes in the Charlevoix seismic zone and surrounding region.
E.1.2.9.3 Recommendations
The Charlevoix paleoseismic study suggests that seismicity may be stationary and localized in the Charlevoix seismic zone. However, the search for paleoliquefaction features outside the Charlevoix seismic zone only extended toward the southwest (Figure E-44). The largest historical earthquake in the region, the 1663 M ~7 earthquake, has been thought to have occurred in the Charlevoix seismic zone but there are new results from studies of terrestrial and subaqueous mass movements that suggest that the 1663 event may have been centered in the Saguenay region instead (e.g., Levesque et al., 2006; Locat, 2008). The Saguenay liquefaction study found evidence for a paleoearthquake about AD 1420 that was larger or located closer to the Ferland-Boilleau valley than the 1988 M 5.9 earthquake, suggesting that an earthquake source capable of large earthquakes may occur in the Saguenay region (Figure E-49). There are large uncertainties regarding the maximum magnitude and recurrence rates of earthquakes in the Charlevoix seismic zone and the Saguenay region. Both may be capable of future large earthquakes that could affect southeastern Canada and northeastern United States. To help address these issues, the following research topics are recommended:
- Additional searches for paleoliquefaction features in the Charlevoix region that might help to improve age estimates and recurrence times of paleoearthquakes. Employ OSL dating to help date liquefaction features at sites where organic material is not available for radiocarbon dating.
- Additional searches for paleoliquefaction features along tributaries of the St. Lawrence River both southwest of Trois Rivières and northeast of the Charlevoix seismic zone to further test the hypothesis that seismicity in the Charlevoix seismic zone is stationary and that its rate of seismicity is higher than other locations along the Iapetan rift margin.
- Additional searches for paleoliquefaction features in the Saguenay region to determine the timing, location, and magnitude of the paleoearthquake about AD 1420 and to test the hypothesis that the 1663 M ~7 earthquake was located in the Saguenay region.
E.2 Uncertainties Associated with Paleoliquefaction Data
E.2.1 Collection of Paleoliquefaction Data
It is advisable that experienced, qualified investigators be involved in planning and execution of paleoliquefaction studies. Lacking familiarity with earthquake-induced liquefaction features and the conditions under which they form, inexperienced investigators can squander time and resources searching for features in the wrong settings, misidentify features in the geologic record, and misinterpret the presence and absence of features.
For the results of a paleoliquefaction study to be most useful in assessing seismic hazards, search areas must be selected where sedimentological and hydrological conditions are conducive for the formation and preservation of liquefaction features. These conditions include (1) the presence of loose to moderately dense sandy sediments that occur below the water table or are otherwise saturated at the time of an earthquake; (2) an overlying layer of less permeable clay or clayey silt to promote the increase in pore-water pressure in and liquefaction of saturated sandy sediment during ground shaking; and (3) an environment of sediment accumulation or relative stability that is not undergoing denudation (Sims, 1975; Obermeier, 1996; Tuttle, 2001).
Utmost care must be taken to correctly identify earthquake-induced liquefaction features and not to confuse them with features that formed as the result of other processes. Deposits and features that have been misidentified as earthquake-induced liquefaction feature include fluvial deposits, chemical weathering, tree-throw, and cultural features. Liquefaction features have certain characteristics, described below and summarized in Section E.1.2, that help to distinguish them from other deposits and features (Figure E-50). For example, the presence of feeder dikes helps to distinguish earthquake-related sand blows from fluvial deposits and deformation related to tree throw. With close examination of deposits and features by an experienced eye, earthquake-induced liquefaction features can be identified with confidence.
Exposure of sediments must be adequate to reveal liquefaction features, if they are present. Dense forests and other vegetation can obscure surficial sand blows, making it difficult to identify them on aerial photographs and satellite images. Agricultural practices such as plowing and grading can disturb and destroy them. Exposures can be created to verify interpretations from aerial photographs and satellite images by excavating trenches in sand blows. Geophysical techniques such as electrical resistivity and ground-penetrating radar can be used to map sand blows and locate sand dikes (Figure E-14; Wolf et al., 1998, 2006; Al-Shukri et al., 2006; Al-Qadhi, 2010). Fieldwork should be conducted at times of the year, and even the time of day in coastal areas, when exposure is optimal in order to minimize chances that liquefaction features are missed due to high water, heavy vegetation, or snow cover. Exposures along actively eroding river cutbanks and recently excavated drainage ditches can be used to search for liquefaction features and to examine their sedimentary characteristics and structural relations.
Field studies should be designed to try to fully characterize the size and spatial distribution of paleoliquefaction features. As the size and frequency of liquefaction features decrease, the more cutbank exposure must be examined to find and characterize them. If liquefaction features are not found, it is important to verify that the search areas are underlain by sediments that are susceptible to liquefaction.
E.2.1.1 Identification of Earthquake-Induced Liquefaction Features
Liquefaction is the phenomenon by which saturated sandy sediments, when subjected to strong ground shaking, lose shear strength as pore-water pressure in the sediments increases, leading to ground failure, injection of sand dikes and sills, ejection of sand volcanoes or sand blows, and formation of sand-blow craters (Figures E-2 and E-50; Seed and Idriss, 1982; Youd, 1984). Sand dikes, sand blows, and sand-blow craters are considered diagnostic of earthquake-induced liquefaction, and their characteristics have been documented following historical (e.g., Dutton, 1889; Fuller, 1912) and modern earthquakes (e.g., Tuttle et al., 1990: Tuttle, Schweig, et al., 2002; Sims and Garvin, 1995). Several notable studies in the Charleston seismic zone (e.g., Amick, Gelinas, et al., 1990; Amick, Maurath, and Gelinas, 1990; Obermeier et al., 1989; and Talwani and Schaeffer, 2001); the New Madrid seismic zone (e.g., Russ, 1982; Saucier, 1991; Tuttle, Schweig, et al., 2002; and Tuttle et al., 2005); and the Wabash Valley seismic zone (e.g., Obermeier et al., 1993; Munson et al., 1997; and Obermeier, 1998) have used paleoliquefaction features to reconstruct the earthquake history from the geologic record (Table E-1.2-2).
The following general criteria have been advanced for identifying earthquake-induced liquefaction features: (1) sedimentary characteristics consistent with case histories of earthquake-induced liquefaction; (2) sedimentary characteristics indicative of sudden, strong, upwardly directed hydraulic force of short duration; (3) occurrence of more than one type of liquefaction feature and of similar features at multiple locations; (4) occurrence in geomorphic settings where hydraulic conditions described in (2) would not develop under nonseismic conditions; and (5) age data to support both contemporaneous and episodic formation of features over a large area (Obermeier, 1996; Tuttle, 2001).
Sand blows are sand deposits that result from liquefaction of loose, saturated, sandy sediment, usually within 15–20 m of the ground surface, and venting of the slurry of pressurized porewater and entrained sediment through fissures, cracks, and other voids to the surface (Figures E-2, E-50, and E-51). In the case of sand-blow craters, a crater forms at the ground surface and the sand blow is deposited around the rim of the crater (Figures E-51 through E-53). In plan view, the shape of the sand blows and sand-blow craters is related to the void through which the slurry vented. Most sand blows and sand-blow craters are elliptical in shape because the slurry vented through fissures (Tuttle and Barstow, 1996). Sand blows and sand-blow craters that are circular in shape result from venting through tubular-shaped voids such as decomposed tree roots and trunks and animal burrows (Audemard and de Santis, 1991; Tuttle, 1999).
In cross section, sand blows usually bury soil horizons and are connected at their bases to one or more feeder dikes or tubular conduits, which are the sand-filled voids through which the fluidized sediment vented (Figures E-2, E-50, and E-54). Sand blows are thickest and coarsest-grained immediately above the feeder dikes or tubular conduits and thin and fine away from the vent. Sand blows often contain clasts of the underlying deposits through which water and sand vented. The clasts tend to be larger and more concentrated above the vent. In cases of ground subsidence related to venting of subsurface sediment or to lateral spreading, the buried soil may dip toward or be displaced across the sand-filled vent structures such as sand dikes. Sand blows and sand-blow craters should exhibit most if not all of these characteristics including a structural connection with feeder dikes (Section E.1.2) and should not be confused with fluvial deposits such as overbank sediments or crevasse splays that bury soils and may be limited in extent.
As mentioned above, sand dikes and tubes are the sand-filled voids resulting from liquefaction of sediment at depth and intrusion of overlying deposits by the pressurized slurry of water and entrained sediment (Figures E-50, E-54, and E-55). Sand dikes usually have well-defined margins and can be differentiated from the host deposit by differences in grain-size and weathering characteristics. Sand dikes originate in a layer of sandy sediment, often referred to as the source bed, that has undergone liquefaction and fluidization. The source beds of sand dikes may lack original sedimentary structure and may exhibit soft-sediment deformation structures such as ball-and-pillow structures and dish structures as well as flow structure or lineations (see Glossary). The sand dikes intrude overlying deposits and crosscut bedding. They often narrow, branch, and become finer-grained upward, are characterized by flow structure, and contain clasts of the deposits that they intrude (Section E.1.2; Obermeier, 1996; Tuttle, 2001). In cases where the slurry of water and sand did not make it to the surface, sand dikes pinch out or terminate within the stratigraphic section (Figure E-2). Extensions of sand dikes, sand sills sometimes form along the base of less permeable layers. Sand-filled root casts and desiccation cracks that branch and pinch downward should not be confused with sand dikes resulting from earthquake-induced liquefaction.
Soft-sediment deformation structures, including sand diapirs, basal erosion, convolute bedding, pseudonodules, load casts and related folds, have been attributed to earthquake-induced liquefaction on the basis of laboratory experiments (Kuenen, 1958) and field studies (Sims, 1973 and 1975; Obermeier, 1996; Tuttle, 1999). During field studies of earthquake-induced liquefaction features, sand diapirs and basal erosion have been found to form where fine-grained deposits overlie coarse-grained deposits (Figures E-2 and E-56). Pieces of the overlying fine-grained sediment founder into the coarse-grained sediment due to loss of its bearing strength during liquefaction. Simultaneously, coarse-grained sediment moves upward to replace the foundered material forming sand diapirs. Sand diapirs and basal erosion may form when ground motions are capable of inducing liquefaction in susceptible sediments but not capable of generating the pore-water pressures required for hydraulic fracturing of the overlying deposits.
Load casts, pseudonodules, and related folds typically form in interbedded fine- and coarse-grained deposits when fine-grained sediment sinks into coarse-grained sediment due to loss of bearing strength (Figure E-57). In cases where layer integrity is maintained, the resulting features are called load casts. In cases where layer integrity is not maintained and coarse-grained sediment separates into domains or irregular masses, the features are called pseudonodules. Pseudonodules, load casts, and related folds typically form close to the sediment-water interface at the time of deposition. It is important to note that the soft-sediment deformation structures mentioned above also can form by non-earthquake processes (e.g., Lowe and LoPicollo, 1974; Lowe, 1975; Allen, 1982; and Owen, 1987). Criteria have been proposed for distinguishing seismic from nonseismic soft-sediment deformation structures. These criteria are similar to those advanced for identifying earthquake-induced sand blows and sand dikes and include the following (Wheeler, 2002):
- evidence for sudden formation,
- synchroneity and zoned map distribution over many exposures,
- size of the structures, and
- tectonic and depositional settings.
Soft-sediment deformation structures that meet these criteria and are used with caution in combination with sand blows and sand dikes may aid in mapping areas of liquefaction and defining the limits of liquefaction fields (e.g., Tuttle and Atkinson, 2010).
E.2.1.2 Dating Liquefaction Features
By dating liquefaction features, it is possible to estimate the ages of the paleoearthquakes that were responsible for their formation. It is important to constrain the ages of liquefaction features as narrowly as possible to help correlate similar-age features across a region and differentiate closely timed events. The dating strategy depends on the type of liquefaction features encountered, as does the likelihood of narrowly constraining their ages. Because it is often possible to determine both maximum and minimum age constraints and thus bracket their ages, sand blows usually provide the best opportunity for estimating the ages of paleoearthquakes with relatively small uncertainties (Figure E-3; Tuttle, 2001). Close maximum age constraint can be determined by dating plant material, such as twigs and leaves, and sediments that were at or near the ground surface and buried by the sand blows at the time of the event (Figure E-58). Similarly, plant material derived from surface soils and incorporated in the vented deposits of sand blows and sand-blow craters also provides close maximum age constraint. For those cases in which samples are reworked, there is more uncertainty regarding their origin and thus their age relation to the liquefaction features.
In addition, minimum age constraint, and sometimes, close minimum age constraint, can be determined for sand blows and sand-blow craters. For example, close minimum age constraint can be achieved by dating plant material and sediment that accumulated in craterlets in the upper surface of sand blows soon after they formed. More commonly, minimum age constraints come from dating plant material in soils that developed in the sand blows over time and from tree roots and cultural pits that extend down into sand blows from above (Figure E-59).
Estimating the age of sand dikes and sand sills usually involves greater uncertainty than for sand blows and sand-blow craters (Tuttle, 2001). This is because dikes and sills may terminate several meters below the ground surface at the time of the paleoearthquake (Figure E-2). Maximum age constraints can be determined by dating the uppermost stratigraphic units that they crosscut or overlie, but these ages may be hundreds to thousands of years older than the liquefaction feature (Figure E-3; Tuttle, Chester, et al., 1999). Minimum age constraints of dikes and sills can be determined by dating roots, animal burrows, and cultural pits that clearly intrude and postdate the liquefaction features or by dating deposits that overlie unconformities that truncate the liquefaction features. However, it is fairly uncommon to find circumstances such as these that help to constrain the minimum age of dikes and sills (Tuttle, 2001). Therefore, age estimates of sand dikes and sills often have large uncertainties. Some investigators will make educated guesses as to the ages of these types of liquefaction features based on weathering characteristics of the features themselves or the approximate age of the deposits in which they occur. There can be large uncertainties in these estimates on the order of thousands of years.
Pseudonodules, load casts, and related folds typically form close to the sediment-water interface at the time of sediment deposition (Figure E-57; Sims, 1973, 1975). Age estimates and related uncertainties for causative earthquakes can be derived by dating the deformed sediments themselves or by dating plant material above and below the deformed sediment. There often are much larger uncertainties in estimating the ages of sand diapirs and basal erosion. This type of soft-sediment deformation may have formed anytime following deposition of the stratigraphic units involved. Maximum age constraint can be established by dating the deformed deposits but the deformation may be hundreds or thousands of years younger than the deposits.
This section provides discussion of dating techniques used in paleoliquefaction studies, including dendrochronology, radiocarbon dating, optically stimulated luminescence, archaeological and stratigraphic context, and soil development. Table E-2.1.3 provides a summary of these dating techniques.
Dendrochronology is the dating of past events through the study of the tree ring record and has the potential to date events to the year and even the season (Table E-2.1.3; Pierce, 1986; Stahle et al., 2004). For example, trees killed by coseismic subsidence along the coast of Washington State helped to provide exact dates of megathrust earthquakes along the Cascadia subduction zone (Atwater et al., 2004). Abrupt changes in soil-moisture conditions due to liquefaction-related subsidence of the ground surface and/or burial by thick sand blows as well as disruption of tree root systems by lateral spreading, may affect tree ring growth and even lead to tree death (Figures E-51 and E-60; Tuttle, 1999). Therefore, trees buried and preserved below sand blows may provide precise dates of paleoearthquakes. Before dendrochronology can be used, however, regional chronologies for affected tree species must be developed. Long-lived tree species provide the best dendrochronology records. In the New Madrid region, a regional chronology has been developed only for baldcypress and only for the past 1,000 years (Stahle et al., 1985). So far, dendrochronology has been used very little in paleoliquefaction studies but has the potential to better constrain age estimates of paleoearthquakes, especially in regions where liquefaction-related ground failures were severe (Table E-2.1.3).
Table E-2.1.3
Summary of Dating Techniques Used in Paleoliquefaction Studies
| Dating Technique | Applicable Time Period (Years BP) | Dating Precision (Years) | Applied in CEUS Regions1 | Selected References2 |
|---|---|---|---|---|
| Dendrochronology | 1–1,000’s | Annual, possibly seasonal | (1) NMSZ | (1) Stahle et al., 1985; Tuttle, 1999 |
| Radiocarbon | 1–50,000 | 10’s–100’s | (1) NMSZ (2) MAR (3) STL (4) WVSZ (5) ALM (6) CSZ (7) AC-CVA (8) NEWBURY (9) CxSZ |
(1) Tuttle et al., 2005 (2) Tuttle et al., 2006 (3) Tuttle, Chester, et al., 1999 (4) Munson and Munson, 1996 (5) Cox, Larsen, et al., 2004 (6) Talwani and Schaeffer, 2001 (7) Obermeier and McNulty, 1998 (8) Tuttle and Seeber, 1991 (9) Tuttle and Atkinson, 2010 |
| Optically stimulated luminescence | 100–100,000 | 10’s–1,000’s | (1) NMSZ (2) MAR (3) WVSZ (4) ALM |
(1) Mahan et al., 2009 (2) Tuttle et al., 2006 (3) Mahan and Crone, 2006 (4) Cox, Larsen, et al., 2004 |
| Archeological context | 1–12,000 | 10’s–1,000’s | (1) NMSZ (2) STL (3) WVSZ | (1) Tuttle et al., 1998, 2000 (2) Tuttle, Chester, et al., 1999 (3) Munson and Munson, 1996 |
| Stratigraphic context | 1–100,000+ | 100’s– 1,000’s | (1) NMSZ (2) WVSZ |
(1) Tuttle, 1999 (2) Hajic et al., 1995; Munson and Munson, 1996 |
| Soil development | 1–100,000+ | Varies with soil property | (1) NMSZ | (1) Tuttle et al., 2000 |
- NMSZ = New Madrid seismic zone and surrounding region; MAR = Marianna Area; STL = St. Louis and surrounding region; WVSZ = Wabash Valley seismic zone and surrounding region; ALM = Arkansas-Louisiana-Mississippi region; CSZ = Charleston seismic zone; AC-CVA = Atlantic Coast and Central Virginia reconnaissance; NEWBURY = Newburyport, Massachusetts, and surrounding region; CxSZ = Charlevoix seismic zone and surrounding region.
- Selected references shown here. Also see paleoliquefaction database and reference lists at the end of this report.
Radiocarbon dating or 14C dating is the most common dating technique used in paleoliquefaction studies (Table E-2.1.3). Although reliable for only the past 50,000 years, radiocarbon dating is useful for the time period of interest for most paleoseismic studies. Uncertainties in the results are related to the dating techniques, to conversion of radiocarbon ages to calibrated ages, and to sampling of materials that are used in dating liquefaction features.
Two different radiocarbon dating techniques are used, depending on the size of the sample (Aiken, 1990). The radiometric technique is used for larger samples (e.g., charcoal ≥ 15 grams, wood ≥ 25 grams, and soil ≥ 200 grams). The accelerator mass spectrometry (AMS) technique is used for smaller samples (charcoal ≥ 20 milligrams, wood ≥ 20 milligrams, and soil ≥ 2 grams).
The radiometric technique involves converting carbon to benzene, measuring the sample’s beta activity in a liquid scintillator, and calculating the radiocarbon age (Aiken, 1990). A precision of better than ± 1%, corresponding to ± 80 radiocarbon years, can usually be achieved for samples that are less than 10 k.y. High-precision measurements can be made on wood samples of ≥ 1 kilogram by measuring the beta activity of the sample in a proportional gas counter (Stuiver et al., 1998). For these very large samples, a precision ± 0.25%, corresponding to ± 20 radiocarbon years, can be obtained.
The AMS technique involves reducing the sample to graphite and then measuring carbon ions in an accelerator mass spectrometer (Aiken, 1990). A precision of about ± 0.5%, corresponding to ± 40 radiocarbon years, can be achieved with the AMS technique. Isotopic fractionation may occur during sample preparation and can affect the radiocarbon age. This effect can be taken into account by measuring the 13C/12C ratio for each sample and making the appropriate correction. Other experimental uncertainties are related to contamination during sample preparation, lack of constancy of counter background and counter efficiency, residual 14C within the accelerator, and human error (Aiken, 1990). These uncertainties are taken into account by applying a laboratory error multiplier (1.3 to 2). The error multiplier is a measure of the laboratory reproducibility and is usually derived from repeated dating of a standard of known or consensus age (Stuiver and Pearson, 1993). Because of its higher precision, the AMS technique is now preferred by many investigators despite its greater cost.
Radiocarbon dating results are reported as both measured and conventional 14C ages. Conventional ages are derived from measured ages by normalizing them to the modern standard through the use of 13C/12C ratios. Because 14C in the atmosphere has fluctuated over time due to variations in cosmic radiation and, recently, to burning of fossil fuels and testing of nuclear devices (Stuiver et al., 1993), it is desirable to convert conventional ages to actual or calendar years by using the radiocarbon calibration curve (Figure E-61; Tuttle, 1999). Although the recent part of the curve (12 k.y.) based on tree-ring records is the most secure and reliable, the calibration curve now extends to 50 k.y. BP (Walker, 2005; Reimer et al., 2009). Several calibration procedures have been developed that are commonly used and yield similar results. These procedures include CALIB (Stuiver and Reimer, 1993; Stuiver et al., 2005), OxCal (Bronk Ramsey, 1995, 2001), and Pretoria (Talma and Vogel, 1993; Vogel et al., 1993). It is preferable to use 2-sigma calibrated dates to either bracket or approximate the ages of the liquefaction features. This assures with a high probability that the actual ages of the liquefaction features fall within the estimated age range. Calibrated ages rarely have 2-sigma ranges of less than 100 years, more often have 2-sigma ranges of about 200–300 years, and sometimes have two or three ranges depending on the number of intercepts of the conventional radiocarbon age with the calibration curve (Table E-2.1.3).
The type and location of samples collected for radiocarbon dating affect the uncertainty of the age estimate of the liquefaction features. Plant remains that occur in close stratigraphic position to a sand blow will fairly closely reflect its age. For example, leaves or burned wood that occur at the contact of a buried soil horizon and an overlying sand blow would provide close maximum age constraint for the sand blow (Figures E-3 and E-58). Similarly, maize kernels, leaves, or burned wood incorporated into the top of a sand blow would provide close minimum age constraint. In contrast, a piece of charcoal within the buried soil or underlying sediment would provide maximum age constraint, but could be hundreds or even thousands of years older than the sand blow. Unless associated with in situ cultural or biological features such as fire pits and tree trunks, a charcoal sample could be reworked, in which case its age relation to the sand blow would be even more uncertain. Bulk samples of soils buried by or developed in sand blows can also be dated. However, radiocarbon dates of soils reflect the mean residence time of carbon in those samples (Trumbore, 1989; Walker, 2005). Also, contamination by young (e.g., modern humic acids) and old (e.g., lignite and calcium carbonate) carbon can be a significant problem in soils. Therefore, dating soils is usually a last resort and requires a sampling strategy to help minimize the uncertainties (Tuttle, 1999).
E.2.1.3.3 Optically Stimulated Luminescence
Luminescence techniques, including optically stimulated luminescence (OSL), provide an estimate of the time since quartz and feldspar grains were last exposed to light (which zeros the luminescence signal). After burial, the luminescence signal grows with exposure to radiation in the surrounding sediments (K, U, Th, Rb). The luminescence signal can be measured in the laboratory and related to the duration of burial and in situ and cosmic radiation environment (Murray and Olley, 2002). In other words, OSL is a numerical method used to determine the amount of time that has passed since sediment was last exposed to light (e.g., Wintle and Murray, 1997; Aitken, 1998; Forman et al., 2000; McKeever, 2001) and therefore holds promise for estimating the ages of paleoearthquakes by dating sediment buried by sand blows and that buries sand blows (Mahan and Crone, 2006; Tuttle et al., 2006; Mahan et al., 2009). The preponderance of age estimates in the CEUS-SSC Project paleoliquefaction database are based on radiocarbon dating conducted over the past 20 years. However, OSL dating of sand blows is being increasingly used and results for several features in the New Madrid (e.g., Clarke River site) and Marianna (e.g., Daytona Beach and St. Francis 500 sites) regions are included in the database.
OSL geochronology is a useful tool that can be used in a variety of terrestrial stratigraphic settings, particularly for sediments that receive brief exposure to sunlight prior to deposition. In general, the technique is most useful for sediments approximately 100 years to more than 100 k.y. old (Forman et al., 2000; Lepper, 2007; LDRL, 2010). As such, OSL dating is useful even further back in time than radiocarbon techniques. The primary difference between radiocarbon dating and OSL dating is that the former is used to date organic materials, whereas the latter is used to date the timing of exposure of certain minerals to light.
The preferred sediment for OSL dating is coarse silt to medium sand (quartz or feldspar) that has had at least one hour of sunlight exposure. Feldspar is both structurally and chemically more variable than quartz and requires longer exposure to sunlight to zero the luminescence signal (i.e., bleach). Accordingly, quartz often results in more reliable dates than feldspar. It is preferred if samples come from a relatively homogeneous stratigraphic unit that is at least 30 cm thick, and has not undergone significant water-content variations or diagenetic changes during burial (LDRL, 2010). OSL analysis of a sample collected from, for example, the sediment immediately below the base of a sand-blow deposit can yield an estimate of the time of the causative earthquake.
Studies have compared the results of OSL and radiocarbon dating of sand blows in the central United States. This was done by dating co-located samples collected above and below sand blows (Mahan and Crone, 2006; Tuttle et al., 2006; Mahan et al., 2009). Correlation of OSL and radiocarbon dates was best for samples collected immediately below sand blows and for samples collected in association with sand blows buried several meters beneath fluvial deposits.
Correlation was poor for samples collected in soils developed in surface sand blows and in sediment buried beneath sand blows that had been subjected to bioturbation.
There are a number of possible uncertainties and errors that can limit the precision and accuracy of OSL dating. The most common complication is that the sediment has not received enough sunlight exposure prior to burial in order to rid the sample of previously acquired luminescence (i.e., “partial” vs. “full” bleaching; Forman et al., 2000). Partial bleaching is very unlikely in eolian and coastal marine sands, but is more likely in Holocene fluvial deposits. This is because light attenuates significantly in water. Additionally, silt and sand grains that are coated with clay may be shielded from the bleaching effects of sunlight.
The accuracy of OSL dating may also be limited in pure quartz deposits because the naturally occurring background radiation in surrounding sediments often is low. As a result, cosmic radiation becomes the main source of ionizing radiation that ejects electrons from atoms in the crystal lattice (which are ultimately the source of the luminescence signal). Because cosmic radiation often fluctuates and attenuates quickly with depth below grade, uncertainty in depositional history has a bigger influence on the overall uncertainty of the resulting OSL age estimates.
Water content of the soil also influences the rate of attenuation of ionizing radiation in situ. As a result, uncertainties in the average water content of the sediment since deposition influences the overall uncertainty of the resulting OSL age estimates. Additional complications include bioturbation, diagenesis and postdepositional weathering, and accumulation of secondary minerals (silica, calcium carbonate, and clay). Therefore, careful selection and sampling of sediment is crucial. Uncertainties in OSL dates increase with sediment age from a few tens to a few hundreds of years for the past 1–10 k.y. and to several thousands of years for the past 10– 100 k.y. (Table E-2.1.3).
E.2.1.3.4 Archeological Context
Archeological chronologies have been developed for many regions. These chronologies are developed primarily on the basis of the following: (1) seriation, or the sequence of artifact and ceramic types particularly within cultural horizons; and (2) radiocarbon dating of organic material associated with artifacts and cultural horizons (Aiken, 1990; O’Brien and Lyman, 1999). Referring to the regional archeological chronologies, artifacts found at liquefaction sites can help to estimate the ages of the liquefaction features (Saucier, 1991; Tuttle, Lafferty, Guccione, et al., 1996; Munson et al., 1997). Some artifact types are well-constrained to specific cultural periods while others are not. Age estimates of liquefaction features based on their archeological context will have uncertainties at least as great as those based on radiocarbon dating (Table E-2.1.3).
Cultural artifacts found in, or associated with, liquefaction features during reconnaissance can provide a preliminary estimate of the ages of the features. The stratigraphic relations of liquefaction features and cultural horizons and features as well as the assemblage of artifacts, especially if diagnostic artifact types are present, can help to further constrain the ages of the liquefaction features (e.g., Tuttle, 2001; Tuttle et al., 2005). For example, the assemblage of artifacts within an A horizon buried by a sand blow can provide an estimate of the maximum age of the liquefaction feature. The assemblage of artifacts within an occupation horizon developed in a sand blow or cultural features such as a storage pit or wall trench dug into a sand blow can provide an estimate of its minimum age (Figures E-58 and E-59). It is important to study assemblages of artifacts since there are still many uncertainties regarding the temporal and geographical ranges of artifact types.
Due to their abundance of organic-rich material, archeological sites often provide good opportunities for finding samples suitable for radiocarbon dating and constraining the age(s) of any liquefaction feature that is present (Tuttle and Schweig, 1995). In these cases, it is desirable to conduct both archeological analyses and radiocarbon dating of organic samples because they provide a means of cross-checking results and add confidence to the age estimates of liquefaction features.
E.2.1.3.5 Stratigraphic Context
Stratigraphic context and relationships can be used as a means to estimate the relative ages of buried sand blows and sand dikes, and to correlate paleoliquefaction features between exposures. The law of superposition, crosscutting relationships, and identification of paleosurface indicators preserved in the stratigraphic record can be used to help determine the relative ages of paleoliquefaction features. Moreover, in an area with laterally continuous stratigraphy or prominent marker beds, age equivalence can be established between different exposures or sites. If the ages of some or all of these strata are determined by numerical or other means at one site, these ages can be extrapolated to other nearby sites. However, correlation of paleoliquefaction features identified in similar-age sediments is potentially problematic. For example, most of the mid- to late-Holocene sand-blow craters identified in the Charleston, South Carolina region are found in beach ridge deposits that are 100 ka and older (McCartan et al., 1984). If only the host deposits had been used to correlate and date paleoliquefaction features, the timing of the events may have been overestimated and the number of paleoearthquakes underestimated. Ages derived through other methods reveal earthquakes separated by significant periods have caused paleoliquefaction features within correlative stratigraphic units.
In addition, stratigraphic context and relationships can be used to place maximum ages on, for example, sand dikes that terminate upward at a stratigraphic level that may be lower than the paleo-ground surface at the time of the causative earthquake Figure E-2). Sand dikes that terminate below the event horizon commonly are encountered outside of the most active seismic zones and at greater distances from the seismic source than sand blows. By numerical or relative dating of the host deposits, it is possible to place at least a maximum age constraint on the timing of dike formation (Figure E-3).
As described above, stratigraphic context can be used to estimate the relative ages of paleoliquefacion features. However, these methods typically are less precise and less accurate than numerical dating techniques and therefore should be calibrated using, for example, radiocarbon or OSL numerical dating methods where possible. Even so, uncertainties in age estimates of paleoliquefaction features based on their stratigraphic context are likely to be on the order of several hundreds to several thousands of years at best (Table E-2.1.3).
The state of a soil system is defined as a function of five soil-forming factors: climate, biological activity, topography, parent material, and time (Jenny, 1941, 1961; Birkeland, 1999). In genetically related suites of soils in which all soil forming factors except for time are about equal, soil profiles, as well as certain soil properties, develop systematically with age (Harden, 1982; Harden and Taylor, 1983). These soil properties include rubification (reddening and brightening of soil colors), clay accumulation, soil structure, consistence, and pH. Therefore, soil profiles and properties can be used to estimate the age of a soil if they are calibrated with numerical techniques, such as radiocarbon dating and OSL dating (Table E-2.1.3).
In most paleoliquefaction studies, soil development is used as a relative dating technique to distinguish young, unweathered features from significantly older, more weathered features. In the New Madrid seismic zone, the thickness of A horizons developed in sand blows has been used to derive preliminary age estimates of sand blows and to aid in the selection of sand blows for detailed investigations (Tuttle et al., 2000). The estimates were based on a rate of A horizon development derived by studying soil characteristics of sand blows of known ages. The age estimates had uncertainties on the order of 100 years, similar to the uncertainties of radiocarbon dating on which the rate of A horizon development was based (Figure E-62).
In a few regions where sand dikes have terminated within the stratigraphic section and organic material and cultural artifacts have not been available for constraining the ages of the features, soil characteristics such as iron staining and accumulation of fine-grained sediment have been used to correlate features over large distances. This practice is not recommended unless the soil characteristics have been calibrated and the uncertainties associated with their rates of development quantified. Otherwise, the spatial correlation of features and the interpretations related to the spatial distribution of those features may be erroneous (Tuttle, 2001).
E.2.2 Uncertainties Related to Interpretation of Paleoliquefaction Data
This section provides discussion of uncertainties related to the interpretation of paleoearthquake parameters from paleoliquefaction data, including the timing, magnitude, and location of paleoearthquakes. Table E-2.2 provides a summary of these uncertainties.
E.2.2.1 Timing of Paleoearthquakes
Uncertainty in the timing of paleoearthquakes is largely a function of age constraints of multiple liquefaction features correlated across a region (Table E-2.2). If ages of liquefaction features cannot be constrained within a few hundred years, it may not be possible to correlate features chronologically, to resolve the timing of paleoearthquakes with confidence, or to estimate recurrence rates for sources with earthquake cycles of less than 1,000 years. Preferably, 2-sigma calibrated radiocarbon dates are used to either bracket or approximate the ages of the liquefaction features. Clustering of age estimates of liquefaction features reflects the timing of paleoearthquakes (Figure E-63). For a particular cluster, the union of well-constrained age estimates of liquefaction features represents the time period during which the paleoearthquake is likely to have occurred. It is not uncommon for this time period to have a range of 100 to 1,000 years. The timing of the event can be expressed as the average of the range plus and minus the difference between the average and the endpoints of the range. A few well-constrained age estimates of liquefaction features can lead to a more narrowly defined range of tens to hundreds of years and thus smaller uncertainties in the timing of the paleoearthquakes (Table E-2.2). For the CEUS-SSC Project, uncertainty ranges of tens to hundreds of years were derived for the timing of paleoearthquakes in the New Madrid and Charleston seismic zones by using subsets of the better-constrained age estimates of liquefaction features (Figure E-64; see Section 6.1.5.4 of the main report).
Table E-2.2
Uncertainties Related to Interpretation of Paleoearthquake Parameters
| Earthquake Parameter | Range in Uncertainty | Factors that Contribute to Uncertainty | Observations and Analyses that Reduce Uncertainty |
|---|---|---|---|
| Timing | 10’s–1,000’s of years | (1) Dating of liquefaction features (2) Use of sand dikes in absence of sand blows |
(1) Well-constrained age estimates of liquefaction features (2) Space-time diagrams (3) Statistical analysis of uncertainty range of age estimates of multiple liquefaction features |
| Location | Few–100’sof km | (1) above
|
(1) through (3) above (4) Size distribution of features (5) Information regarding uncertainty factors (3a) through (3g). (6) Field studies conducted where sedimentary and hydrologic conditions suitable for formation and preservation of liquefaction features, and when adequate exposure available to find features, if present (7) Comparative study with calibration event in same region (8) Relationship to active fault |
| Magnitude | 0.25–1 unit | (1) through (4) above (5) Epicentral distance to farthest sand blow unlikely to be known (6) Changes in source sediments due to liquefaction or to post liquefaction effects such as cementation and compaction |
(1) through (8) above (9) Empirical relations based on global database of earthquakes that induced liquefaction (10) Evaluation of scenario earthquakes using liquefaction potential analysis |
| Recurrence time | 10’s–1,000’s of years | (1) Uncertainty in timing of paleoearthquakes (2) Completeness of paleoearthquake record in space and time |
(1) Well-constrained age estimates of paleoearthquakes (2) Space-time diagrams (3) Consideration of history of sedimentation and erosion as well as of changes in water table |
E.2.2.2 Correlation of Liquefaction Features
The correlation of liquefaction features between sites is necessary for interpretation of the timing, location, and magnitude of paleoearthquakes. This correlation is based on available information, including one or more of the following:
- Chronological control: Paleoearthquakes are distinguished based on grouping paleoliquefaction features that have overlapping age estimates. As described above, sand blows typically are best to use due to more straightforward identification of the event horizon and their typically better-constrained age estimates, whereas the event horizon and age estimates associated with sand dikes often are relatively poorly constrained.
- Size distribution: Paleoearthquakes are distinguished based on the assumption that feature size diminishes with ground shaking and therefore with magnitude of, and distance from, the causative earthquake. The size distribution of liquefaction features is important for interpreting whether similar-age features formed during single large earthquake or multiple smaller earthquakes.
- Stratigraphic control: Paleoearthquakes are distinguished based on grouping paleoliquefaction features found in similar-age sediments (see caveats described in Section E.2.1.3.5 of this appendix).
- Pedologic or weathering characteristics: Paleoearthquakes are distinguished based on grouping paleoliquefaction features with similar soil or weathering characteristics (see caveats described in E. 2.1.3.6 of this appendix).
If the information described above provides conflicting correlations for a specific field study, it is incumbent upon the researcher to assess the relative qualities of the different sources of information, and to thereby define a preferred interpretation of the available data.
Earthquake ages are defined by selecting the age range common to multiple sand blows in a region. For example, an earthquake age can be defined by the union or the intersection of overlapping 2-sigma radiocarbon age estimates of sand blows. Using the union of overlapping age estimates may be overly conservative since they may include poorly constrained age estimates. Using the intersection of overlapping age estimates may provide the best estimate of the earthquake age, so long as there is a high degree of confidence in the accuracy of the age estimates.
E.2.2.3 Location of Paleoearthquakes
Once they have been correlated across a region on the basis of one or more of the criteria described above (e.g., chronological or stratigraphic control), liquefaction features, particularly sand blows and sand dikes, can be used to infer the approximate locations of paleoearthquakes. The regional distribution of contemporaneous liquefaction features, sometimes referred to as the liquefaction field, is thought to reflect the meizoseismal (strong shaking) area or source area of a particular paleoearthquake, and the area with the concentration of the largest liquefaction features is interpreted as the epicentral area (Tuttle, 2001; Castilla and Audemard, 2007) or energy center (Obermeier et al., 2001). As mentioned above in Section E.2.1.1, soft-sediment deformation structures such as basal erosion and related sand diapirs may be useful in delineating the outer limits of liquefaction fields so long as they meet certain criteria and are used in combination with sand blows and sand dikes. Lone occurrences of liquefaction features may be indicators of unique site conditions and should be interpreted with care.
As demonstrated by modern earthquakes, sand blows generally decrease in size and frequency with increasing distance from the epicenter (e.g., Ambraseys, 1988; Castilla and Audemard, 2007). Nevertheless, the size and spatial distribution of sand blows can be influenced by a variety of factors including style of faulting, earthquake characteristics, directivity of seismic energy, attenuation and amplification of ground motion, relative density of sediments, distribution of liquefiable sediments, and water table depth as demonstrated by recent earthquakes such as the 1988 M 5.9 Saguenay, Quebec; 1989 M 6.9 Loma Prieta, California; and 2001 M 7.7 Bhuj, India, earthquakes. The complexity of processes and conditions influencing sand-blow formation contribute to uncertainties in interpreting paleoliquefaction data. Accounting for various seismological, geological, and hydrological factors may help to reduce uncertainties to some degree. In addition, the sampling strategy and sediment exposure will affect uncertainties related to the spatial distribution of paleoliquefaction features. If sampling, or searching, for liquefaction features is not performed where conditions are suitable for the formation and preservation of liquefaction features and at times when exposure is adequate to find features, information gained during paleoliquefaction studies may be skewed spatially and/or temporally, which can lead to erroneous interpretations.
Taking together the possible factors affecting the occurrence and observation of paleoliquefaction features, uncertainty in interpreting the locations of paleoearthquakes from paleoliquefaction data is probably on the order of tens to hundreds of kilometers (Table E-2.2). Modern earthquakes that induced liquefaction, such as the 1988 M 5.9 Saguenay, Quebec, and 2001 M 7.7 Bhuj, India, earthquakes, whose locations and magnitudes are fairly well known, can be used to demonstrate the uncertainty in interpreting locations of earthquakes from liquefaction data. If the concentration of liquefaction features that formed near Ferland, Quebec, in 1988 was interpreted as the earthquake’s epicentral area, the inferred location would be off by 25–30 km (Figure E-46). Similarly, if large sand-blow craters that formed along the Allah Bund during the 2001 Bhuj earthquake were interpreted as the epicentral area, the inferred earthquake location would be in error by 100–130 km.
Modern and historical earthquakes that induced liquefaction can serve as calibration events for interpreting paleoliquefaction features. If the size and spatial distribution of liquefaction features generated by a paleoearthquake are similar to those for a modern or historical earthquake in the same region, the paleoearthquake can be inferred to have a similar source area to that of the modern or historical earthquake. For example, the source area of the 1886 Charleston, South Carolina, earthquake is thought to have produced several large paleoearthquakes in the past 5,500 years, judging from similar spatial distributions of historical and prehistoric sand-blow craters (Talwani and Schaeffer, 2001).
Similarly, the New Madrid seismic zone is thought to be the source of several sequences of large paleoearthquakes like the 1811-1812 earthquake sequence, judging from the size, internal stratigraphy, and spatial distributions of historical and prehistoric sand blows (Figures E-65 and E-66; Tuttle, Schweig, et al., 2002; Tuttle et al., 2005). In comparative studies, however, the accuracy of the inferred locations of the paleoearthquakes is less than that for the modern or historical earthquakes, usually a few kilometers to a few tens of kilometers, respectively. For example, the location of the 1886 Charleston, South Carolina, earthquake has an uncertainty of about ± 25 km (e.g., Johnston, 1996c). Therefore, an estimated location of a paleoearthquake based on a comparison of its liquefaction field with that of the 1886 earthquakes will have an uncertainty of at least 25 km. If paleoliquefaction features can be directly related to a fault, such as has been done with the Reelfoot fault in the New Madrid seismic zone, uncertainty in the location of the paleoearthquake may be reduced to just a few kilometers (e.g., Kelson et al., 1996; Tuttle, Schweig, et al., 2002; Table E-2.2).
E.2.2.4 Magnitude of Paleoearthquakes
As demonstrated by case studies of instrumentally recorded earthquakes that induced liquefaction, the size of sand blows, as well as the epicentral distance of sand blows, increases with earthquake magnitude (e.g., Ambraseys, 1988; Castilla and Audemard, 2007). Therefore, the size and spatial distribution of paleoliquefaction features can help to estimate the magnitudes of paleoearthquakes (e.g., Obermeier, 1996; Tuttle, 2001). Due to the many factors affecting the occurrence, distribution, and observation of liquefaction features as described above in Section E.2.2.3, however, uncertainty in magnitudes of paleoearthquakes estimated from paleoliquefaction data can be fairly large, perhaps ranging up to 1 magnitude unit. The uncertainty can be reduced by conducting comparative studies, using empirical relations, and performing geotechnical analysis to better constrain the magnitudes of paleoearthquakes (Table E-2.2; Tuttle, 2001).
In comparative studies, the size and spatial distribution of sand blows generated by a paleoearthquake are compared to those induced by a local modern or historical earthquake, whose magnitude is fairly well known. For example, paleoearthquakes centered in the New Madrid seismic zone about AD 1450 (500 yr BP) and AD 900 (1,050 yr BP) are thought to be on the order of M 7 to 8 based on the similarity in the size and spatial distribution of sand blows with those that formed during the 1811-1812 New Madrid earthquakes (Figures E-65 and E-66; Tuttle, Schweig, et al., 2002). A similar approach was used in the southeastern U.S. comparing the spatial distribution of paleoliquefaction features to those that formed during the 1886 M ~7 Charleston, South Carolina, earthquake (Talwani and Schaeffer, 2001). In studies such as these, the uncertainty related to the inferred magnitudes of the paleoearthquakes is greater than that for the modern and historical earthquakes, usually 0.25 to 0.75 of a magnitude unit, respectively. For example, magnitude estimates of the main shocks of the 1811-1812 New Madrid earthquake sequence have uncertainties of 0.5 to 0.7 of a magnitude unit (see Figure E-66).
Empirical relations have been developed between earthquake magnitude and epicentral distance of sand blows as well as distance of sand blows from the seismic energy source or fault rupture (e.g., Kuribayashi and Tatsuoka, 1975; Ambraseys, 1988). These relations were derived using regional and worldwide databases of instrumentally recorded earthquakes that induced liquefaction. The worldwide database included earthquakes in areas of low as well as high ground motion attenuation and differentiated between shallow- and intermediate-depth events. Subsequently, the worldwide database of earthquakes that induced liquefaction and the empirical relation between earthquake magnitude and epicentral distance of sand blows were updated (Figure E-67; Castilla and Audemard, 2007). In addition, the effects of various earthquake characteristics on liquefaction were studied. The style of faulting was found to influence both size and epicentral distance of liquefaction features, with thrust or reverse faulting causing the largest and farthest sand blows. Directivity of seismic energy along fault planes also appears to be an important factor (Tuttle, Hengesh, et al., 2002; Castilla and Audemard, 2007). Despite these effects, the relation between earthquake magnitude and epicentral distance of sand blows was found to be a useful estimator of approximate magnitudes of pre-instrumental earthquakes (Castilla and Audemard, 2007).
The earthquake magnitude-liquefaction distance relations have been used in paleoliquefaction studies to estimate magnitudes of paleoearthquakes from their farthest observed sand blows. This method is sometimes referred to as the magnitude-bound procedure (Obermeier, 1996). Magnitude estimates derived from these relations are considered minimum values since the actual epicentral distance to farthest sand blow is unlikely to be known (Tuttle, 2001; Castilla and Audemard, 2007). A great deal of reconnaissance by an experienced investigator is often required to find and recognize distal sand blows since they become smaller, less frequent, and may occur in areas underlain by sediments that are especially susceptible to liquefaction. The distance to the farthest observed sand dikes should not be used to estimate magnitudes of paleoearthquakes. To do so could lead to overestimation of paleoearthquake magnitudes since sand dikes can form at greater distances than sand blows, and the magnitude-distance relations were based on “surface manifestations” of liquefaction.
The magnitude-distance relations have been used to estimate magnitudes of paleoearthquakes in the New Madrid and Wabash Valley seismic zones. For New Madrid, minimum magnitudes of M 6.7 and 6.9 were estimated for the paleoearthquakes of AD 1450 (500 yr BP) and AD 900 (1,050 yr BP), respectively, from the distance of observed sand blows (Figure E-68; Tuttle, 2001). Even though more than 1,000 km of river cutbanks have been searched, the limits of liquefaction have not yet been defined for these earthquakes. To improve the magnitude estimates of paleoearthquakes centered in the Wabash Valley seismic zone, the magnitude-bound relation was calibrated using one modern and several historical cases of earthquake-induced liquefaction in the Central and Eastern United States and southeastern Canada (Olson et al., 2005b). This was done in an attempt to account for regional differences in earthquake source characteristics, ground motion attenuation, local site effects, and liquefaction susceptibility of sediments. The magnitude estimates based on the calibrated relation differed little (0 to 0.1 magnitude unit) from those using the worldwide relation developed by Ambraseys (1988), suggesting that historical earthquakes, with poorly constrained locations and magnitudes, are unlikely to significantly improve the worldwide relation based on instrumental earthquakes. Calibration of the magnitude-bound relation may be most fruitful for regions that have experienced instrumental earthquakes that induced liquefaction.
There are several obvious factors that contribute to uncertainties in magnitude estimates for paleoearthquakes based on the magnitude-bound method. The epicentral location may be poorly defined and the farthest sand blow is unlikely to be known. In addition, the magnitude-distance relation itself has some inherent uncertainties since the epicentral distance to the farthest sand blow may not be known even for instrumental earthquakes. The relation is poorly constrained for earthquakes greater than magnitude 7.2 (Figure E-67).
Given the various unknowns, uncertainties associated with magnitude estimates determined with the magnitude-bound method are likely to range from 0.25 to 0.6 magnitude unit (Table E-2.2). The 2001 M 7.7 Bhuj, India, earthquakes can be used to demonstrate the uncertainty in magnitude estimates derived using the magnitude-bound method. If the small sand blows that formed near Ahmedabad (approximately 240 km from the epicenter of the Bhuj earthquake) were not found and those along the Allah Bund (about 130 km from the epicenter of the Bhuj earthquake) were thought to be the farthest sand blows induced by a paleoearthquake centered near Bhuj, a magnitude estimate of 7.1 would be derived using the method (Figure E-46). In this example, the magnitude-bound method would have underestimated the magnitudes of the hypothetical paleoearthquakes by 0.6 magnitude unit.
E.2.2.4.3 Geotechnical Analysis
In addition to the methods described above, the magnitudes of liquefaction-inducing paleoearthquakes also can be estimated using geotechnical characterizations of in situ soil properties and liquefaction potential analysis (e.g., Olson et al., 2001, 2005b; Green et al., 2005). The cyclic-stress (e.g., Seed and Idriss, 1982; Youd, 2001; Cetin et al., 2004) and seismic energy (e.g., Pond, 1996) methods of liquefaction potential analysis have been applied in paleoearthquake studies. Typically, these back-calculations are based on the identification of the soil layers that may have liquefied during paleoearthquakes, the measurement of geotechnical properties of these layers (penetration resistance, soil density, effective confining or overburden stress, etc.), and the relation between the geotechnical properties and the ground motions necessary to trigger liquefaction. The geotechnical approach to back-calculating magnitudes of paleoearthquakes has been used widely in the Charleston seismic zone (e.g., Hu et al., 2002a, 2002b; Leon, 2003; Leon et al., 2005; Gassman et al., 2009) and the Wabash Valley seismic zones (e.g., Obermeier et al., 1993; Olson et al., 2001). It has also been used to a more limited extent in the New Madrid seismic zone (e.g., Schneider and Mayne, 2000; Schneider et al., 2001; Liao et al., 2002; Stark, 2002; Tuttle and Schweig, 2004) and the Charlevoix seismic zone (e.g., Tuttle and Atkinson, 2010; Table 1.2-1).
Green et al. (2005) identify three main sources of uncertainty associated with the back-calculation of ground motion characteristics from paleoliquefaction data:
- Uncertainty due to changes in the geotechnical properties of the source sediments of liquefaction features, including but not limited to density changes due to liquefaction and to post liquefaction effects related to aging and groundwater conditions.
- The selection of appropriate geotechnical soil indices to be measured at paleoliquefaction sites.
- The selection of appropriate methodology for integration of back-calculated results of ground shaking from individual paleoliquefaction sites into a regional assessment of paleoseismic strength of shaking. An appropriate methodology must account for uncertainty in seismic parameters (e.g., amplitude, duration, frequency, and directivity), regional ground motion attenuation, local site effects, and site-to-source distance.
- The understanding of these sources of uncertainty remains the focus of ongoing research. At present, the geotechnical approach may yield a broad range of possible magnitudes for a given paleoearthquake, and these ranges may provide only a minimum constraint on magnitude. For example, Leon et al. (2005) calculate magnitude estimates for each of the Charleston paleoearthquakes and, for each paleoearthquake, their estimates vary by 0.8 to 1.4 magnitude units. For the CEUS-SSC Project, estimates of paleoearthquake magnitude based on geotechnical analysis were used where available to help characterize Mmax, in conjunction with other indicators of magnitude such as magnitude-bound and magnitude-feature size relations (e.g., Ambraseys, 1988; Castilla and Audemard, 2007).
E.2.2.5 Recurrence of Paleoearthquakes
E.2.2.5.1 Age Estimates of Liquefaction Features and Paleoearthquakes
As described above, the goal of dating seismically induced paleoliquefaction features is to bracket the time of the causative earthquake as tightly as possible. Typically, numerical constraining ages are obtained that predate and postdate paleoliquefaction features. The timing of paleoearthquakes is defined by selecting the age range common to multiple paleoliquefaction features in a region. Therefore, the precision with which recurrence can be calculated depends on the precision of the estimated timing of the paleoearthquakes. Once a paleoearthquake chronology (or alternative paleoearthquake scenarios) has been developed using methodologies outlined above, estimates of earthquake recurrence can be calculated for that region. Well-constrained age estimates of paleoearthquakes contribute to well-constrained estimates of recurrence times (Table E-2.2). For the CEUS-SSC Project, paleoliquefaction data were used to estimate uncertainty ranges for the timing of paleoearthquakes and to calculate rates of repeated large-magnitude earthquakes (see Section 6.1.5.4 of the main report). For example, well-constrained age estimates of sand blows in the New Madrid seismic zone contributed to well-constrained ages estimates of paleoearthquakes (10–100 years) during the past 1,200 years (Figure E-64). However, incompleteness of the paleoearthquake record prior to 1,200 yr BP and questions regarding sources outside the New Madrid seismic zone led to significant uncertainty in recurrence time (tens to thousands of years) of repeated large-magnitude earthquake (RLME) sources in the greater New Madrid region.
E.2.2.5.2 Length and Completeness of the Paleoliquefaction Record
The completeness of the paleoearthquake record should be considered in estimating earthquake recurrence. The completeness of the record will vary depending on the location of the study area and its geologic and hydrologic history. The longer and more continuous the history of sedimentation, the more complete the earthquake record is likely to be (Table E-2.2). Also, loose sandy sediments must be saturated in order to liquefy during earthquakes. Therefore, significant changes in land level and sea (or lake) level related to glacio-eustatic processes can affect the liquefaction susceptibility of sediments and thus the completeness of the earthquake record. These changes may be especially important in glaciated and coastal regions.
Many paleoearthquake chronologies are limited by the age range, distribution, and exposure of the deposits that were susceptible to liquefaction during the period of interest. In the New Madrid region, for example, liquefiable fluvial deposits are widespread, but the deposits, in general, increase in age from east to west across the Lower Mississippi River valley. A large percentage of the liquefiable fluvial deposits in the immediate vicinity of the New Madrid seismic zone are only five thousand years old, so the record of paleoearthquakes is relatively short. In addition, older sand blows may be buried too deep in the section to be exposed in river and ditch cutbanks. Like many depositional environments where paleoliquefaction features form, exposure in the Lower Mississippi River valley is limited to times of year when the water table is low.
Liquefaction features identified along the South Carolina coast range in age from mid-Holocene to historical, but it remains unclear whether the older portions of the Charleston paleoearthquakes record is complete. Talwani and Schaeffer (2001) suggest that the record is complete only for the most recent approximately 2,000 years and that it is possible that liquefaction events are missing from the older portions of the record, especially between about 2,000 and 5,000 yr BP. Talwani and Schaeffer (2001) suggest that past fluctuations in sea level have produced time intervals of low water table conditions, and thus low liquefaction susceptibility, during which large earthquakes may not have induced liquefaction. Similarly, the Late Wisconsin–Holocene record of paleoearthquakes in the Charlevoix seismic zone and St. Lawrence Lowlands is thought to be incomplete due to fluctuations in sea level, especially during the period between 6 and 7 ka (Tuttle and Atkinson, 2010).
By evaluating the completeness of the paleoearthquake record, informed decisions can be made regarding which data sets or portions of data sets to use to estimate realistic recurrence times. Incomplete data sets can provide a minimum numbers of earthquakes for a certain time period and help to constrain recurrence rates.
E.2.3 Recommendations for Future Research
Liquefaction studies have contributed to the characterization of seismic sources by providing information about the timing, locations, magnitudes, and recurrence rates of paleoearthquakes. However, there are often large uncertainties associated with these earthquake parameters. In addition, there are few trained professionals to carry out this type of study. With additional development of the field of study and of trained personnel, it may be possible to reduce uncertainties associated with earthquake parameters and advance the usefulness and application of paleoliquefaction studies. To this end, recommendations for future research are given below.
Development of a manual of best practice would provide guidance in conducting paleoliquefaction studies and would promote accuracy and completeness of paleoliquefaction data. The manual could be complemented by training workshops with experts in the field. During these workshops, professional earth scientists and the next generation of paleo seismologists would gain experience searching for, documenting, and interpreting liquefaction features.
Case studies of liquefaction induced by modern earthquakes, with well-constrained locations, magnitudes, and other earthquake parameters, are encouraged and would help to further characterize the size and spatial distributions of liquefaction features. Such case studies should be regional in scope and include detailed descriptions of liquefaction features such as size and sedimentary characteristics of sand blows, dikes, sills and other soft-sediment deformation structures (see Section E.2.1.1 and Figure E-2). These case studies would be helpful in providing analogue events for direct comparison as well as information that could be used to further improve empirical relations of earthquake and liquefaction parameters.
To gain a better understanding of both the processes of liquefaction and the effects on the source beds that liquefied, instrumentation of liquefaction-prone sites is encouraged, as is pre- and post-event measurement of geotechnical properties. This information may help to reduce uncertainties related to back-calculating magnitudes using post-event measurements. Field experiments of earthquake-induced liquefaction are more likely to be conducted in interpolate settings where large earthquakes occur more frequently. Therefore, if results of these field experiments are to be applied in the CEUS, it would be beneficial to better understand differences between characteristics of intraplate and interpolate earthquakes, such as frequency content and attenuation of ground motion, that influence liquefaction.
In regions where paleoearthquake records exist but have not been fully developed, paleoseismic studies could be designed that would improve the completeness and extend the length of the paleoearthquake chronologies in order to improve recurrence estimates of large earthquakes and to improve understanding of earthquake sources. It is also recommended that paleoliquefaction studies be conducted in regions of low seismicity that share geologic and tectonic characteristics with known seismogenic zones to better understand the earthquake potential of these regions and to test the hypothesis that inherited structure, particularly faults that were active during the Mesozoic, controls seismicity in the CEUS.
Radiocarbon and OSL are the two most common dating techniques used in paleoliquefaction studies. Because they are often collected stratigraphically above and below sand blows, samples provide minimum and maximum constraining dates for liquefaction features and thus the earthquakes that caused them. Although the individual dates may have precisions of ± 20–80 years, the age estimates of liquefaction features based on the combination of the minimum and maximum constraining dates will have uncertainties of about 100 years in the best of circumstances (see Figure E-3). Dating techniques that provide more precise results and dating strategies that provide more accurate results would help to improve age estimates of liquefaction features and thus their causative earthquakes. Dendrochronology is one technique that could improve precision of age estimates of liquefaction features. Therefore, we recommend that efforts be made to use dendrochronology to date paleoliquefaction features in regions where chronologies of long-lived tree species already have been developed. If those efforts are successful, it would be worthwhile to extend the chronologies of long-lived tree species further back in time and to help constrain the ages of older liquefaction features.
E.3 Guidance for the Use of Paleoliquefaction Data in Seismic Source Characterization
The following is a summary of guidance for the use of paleoliquefaction data:
- Ensure liquefaction features have an earthquake origin and are not the result of other processes. Potential uncertainties regarding feature identification and interpretation are described in Section E.2 of this appendix.
- Use liquefaction features with well-constrained calibrated (2-sigma) ages to determine timing of paleoearthquakes (Figure E-3). Space-time diagrams illustrating age constraints and estimated ages of features can help to estimate timing of paleoearthquakes.
- Correlate features that are similar in age and/or occur in similar stratigraphic context within the same exposure or where strata are laterally continuous.
- Compare size and distribution of paleoliquefaction features with those that formed during modern or historical earthquakes in the same or similar geologic and tectonic settings to help interpret the source areas and magnitudes of causative earthquakes.
- Use information on surficial geology, geologic and groundwater history, and geotechnical data and analysis, to help interpret the source areas and magnitudes of paleoearthquakes. Time-slice maps and animations may help to interpret earthquake source areas, and ground motion simulations may help to interpret earthquake magnitudes.
- Use empirical relations developed from case studies of modern earthquakes in similar geologic and tectonic settings to estimate magnitudes of paleoearthquakes on the basis of maximum distance of sand blows from the inferred epicenters.
- If sufficient data are available, incorporate the effect of ground motion parameters (e.g., attenuation and site response) on the size and distribution of liquefaction features when interpreting source areas and magnitudes of paleoearthquakes.
- Consider the completeness of the paleoearthquake record in both space and time when estimating source areas, magnitudes, and recurrence times of paleoearthquakes.
- If sufficient data are available, estimate recurrence times of paleoearthquakes with well-defined timing, source areas, and magnitudes of paleoearthquakes.
Figure E-1
Map of CEUS showing locations of regional data sets included in the CEUS-SSC Project paleoliquefaction database, including New Madrid seismic zone and surrounding region; Marianna, Arkansas, area; St. Louis region; Wabash Valley seismic zone and surrounding region; Arkansas-Louisiana-Mississippi region; Charleston seismic zone; Atlantic Coastal region and the Central Virginia seismic zone; Newburyport, Massachusetts, and surrounding region; and Charlevoix seismic zone and surrounding region
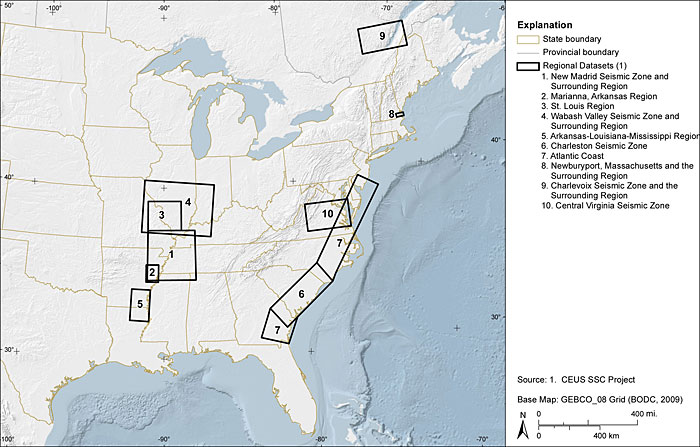
Figure E-2
Diagram illustrating size parameters of liquefaction features, including sand blow thickness, width, and length; dike width; and sill thickness, as well as some of the diagnostic characteristics of these features
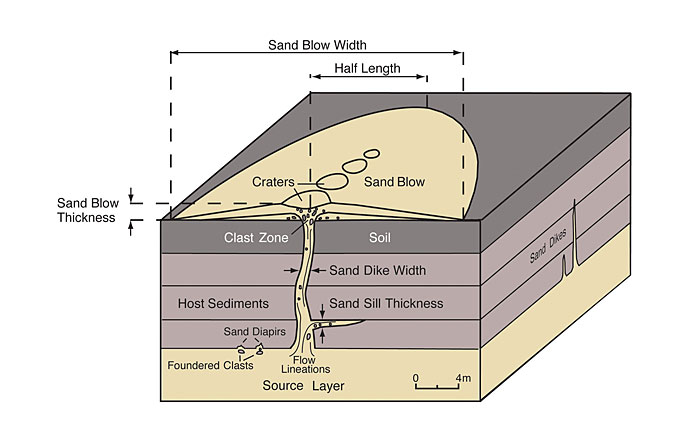
Figure E-3
Diagram illustrating sampling strategy for dating of liquefaction features as well as age data, such as 14C maximum and 14C minimum, used to calculate preferred age estimates and related uncertainties of liquefaction features
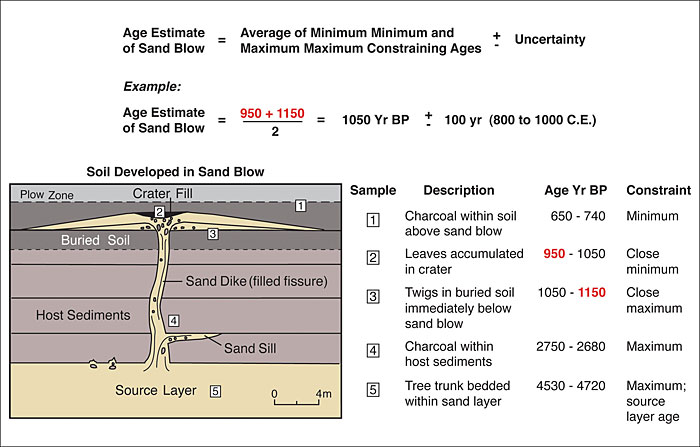
Figure E-4
GIS map of New Madrid seismic zone and surrounding region showing portions of rivers searched for earthquake-induced liquefaction features by M. Tuttle, R. Van Arsdale, and J. Vaughn and collaborators (see explanation); information contributed for this report. Map projection is USA Contiguous Albers Equal Area Conic, North America Datum 1983
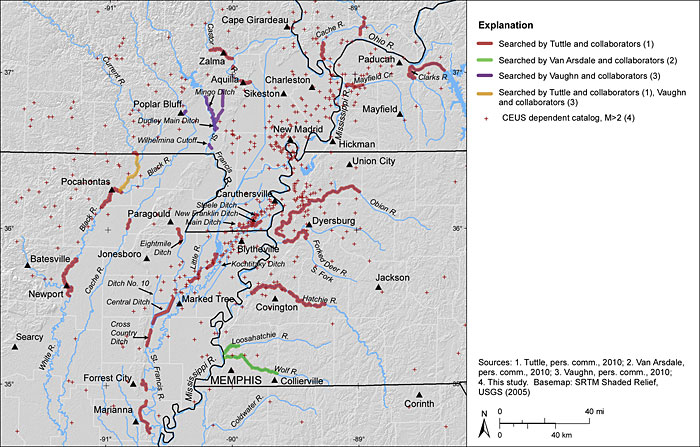
Figure E-5
GIS map of New Madrid seismic zone and surrounding region showing locations of liquefaction features for which there are and are not
radiocarbon data. Map projection is USA Contiguous Albers Equal Area Conic, North America Datum 1983
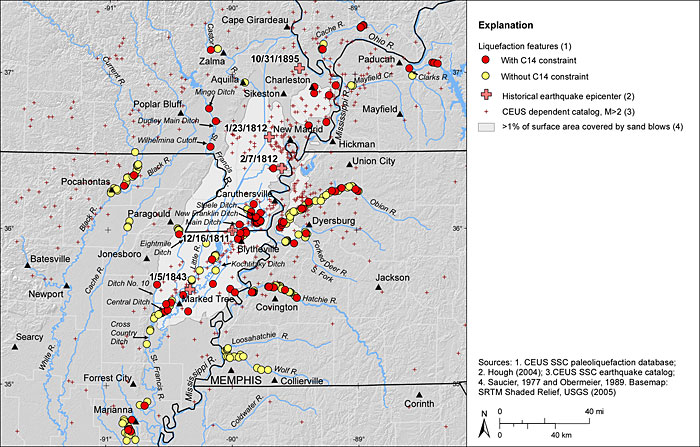
Figure E-6
GIS map of New Madrid seismic zone and surrounding region showing locations of liquefaction features that are thought to be historical or prehistoric in age or whose ages are poorly constrained. Map projection is USA Contiguous Albers Equal Area Conic, North America Datum 1983
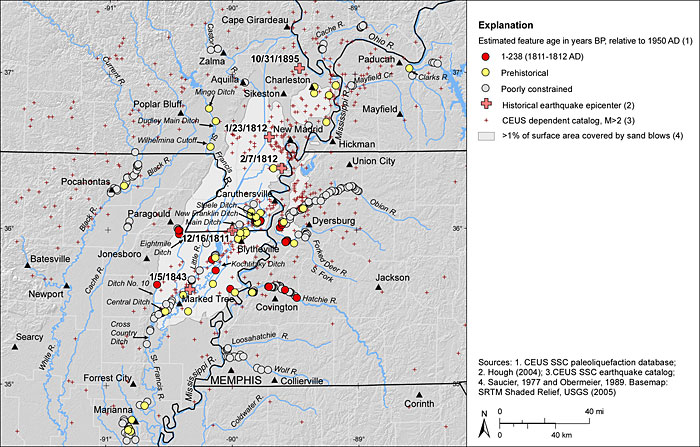
Figure E-7
GIS map of New Madrid seismic zone and surrounding region showing preferred age estimates of liquefaction features; features whose ages are poorly constrained are excluded. Map projection is USA Contiguous Albers Equal Area Conic, North America Datum 1983
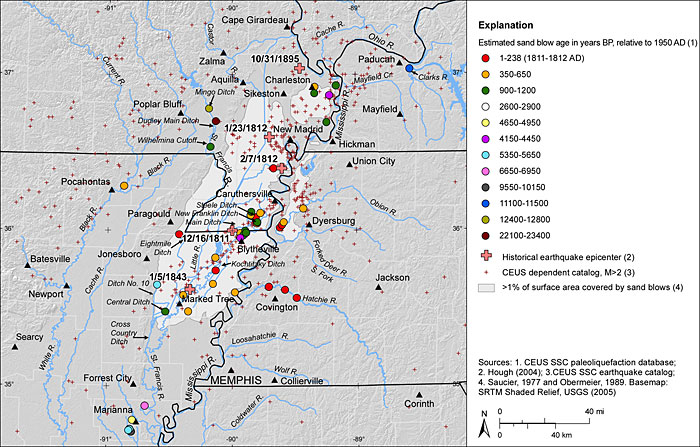
Figure E-8
GIS map of New Madrid seismic zone and surrounding region showing measured thicknesses of sand blows. Map projection is USA Contiguous Albers Equal Area Conic, North America Datum 1983
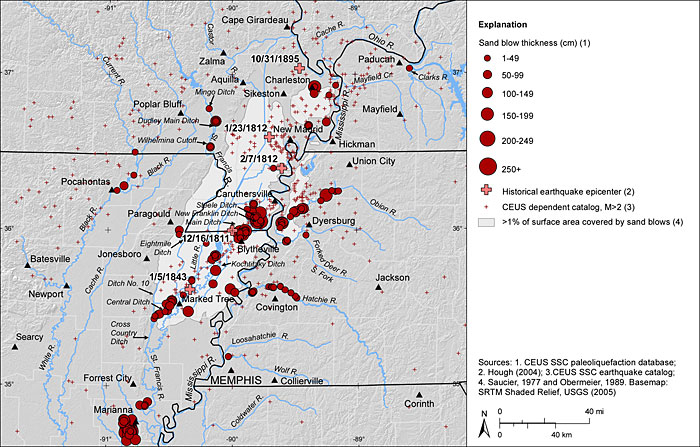
Figure E-9
GIS map of New Madrid seismic zone and surrounding region showing preferred age estimates and measured thicknesses of sand blows. Map projection is USA Contiguous Albers Equal Area Conic, North America Datum 1983
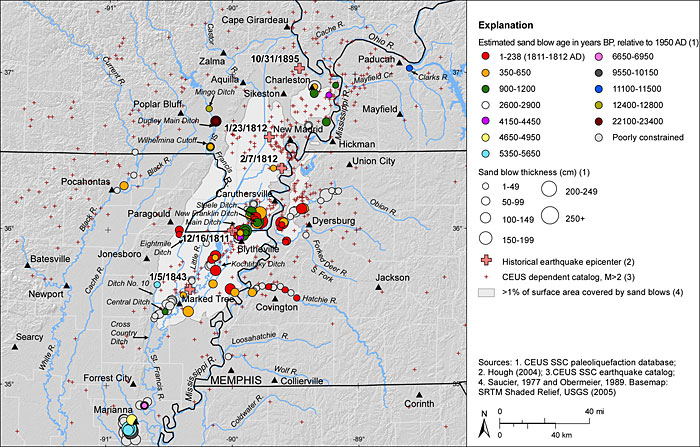
Figure E-10
GIS map of New Madrid seismic zone and surrounding region showing measured widths of sand dikes. Map projection is USA Contiguous Albers Equal Area Conic, North America Datum 1983
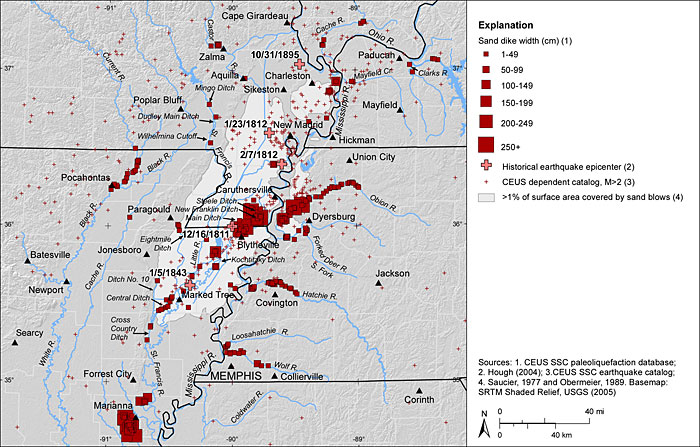
Figure E-11
GIS map of New Madrid seismic zone and surrounding region showing preferred age estimates and measured widths of sand dikes. Map projection is USA Contiguous Albers Equal Area Conic, North America Datum 1983
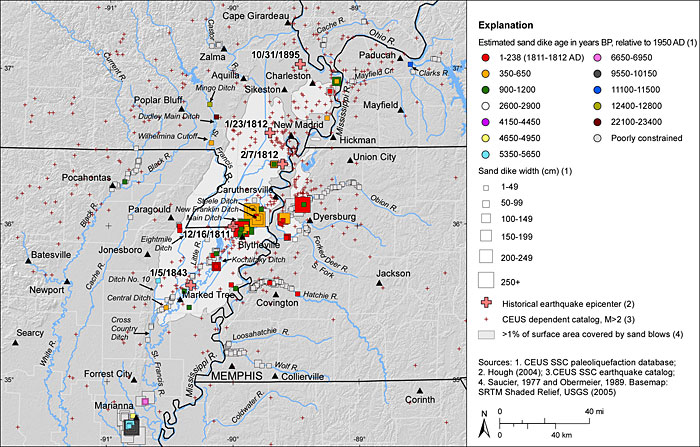
Figure E-12
GIS map of New Madrid seismic zone and surrounding region illustrating preferred age estimates and measured thicknesses of sand blows as well as preferred age estimates and measured widths of sand dikes for sites where sand blows do not occur. Map projection is USA Contiguous Albers Equal Area Conic, North America Datum 1983

Figure E-13
GIS map of Marianna, Arkansas, area showing seismicity and locations of paleoliquefaction features relative to mapped traces of Eastern Reelfoot rift margin fault, White River fault zone, Big Creek fault zone, Marianna escarpment, and Daytona Beach lineament. Map projection is USA Contiguous Albers Equal Area Conic, North America Datum 1983

Figure E-14
(A) Trench log and (B) ground-penetrating radar profile, showing vertical sections of sand blows and sand dikes at Daytona Beach SE2 site along the Daytona Beach lineament southwest of Marianna, Arkansas. Vertical scale of GPR profile is exaggerated (modified from Al-Shukri et al., 2009)
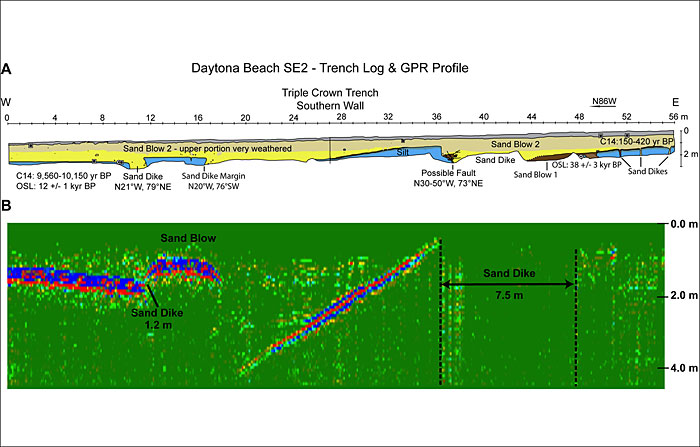
Figure E-15
GIS map of Marianna, Arkansas, area showing locations of liquefaction features for which there are and are not radiocarbon data. Map projection is USA Contiguous Albers Equal Area Conic, North America Datum 1983
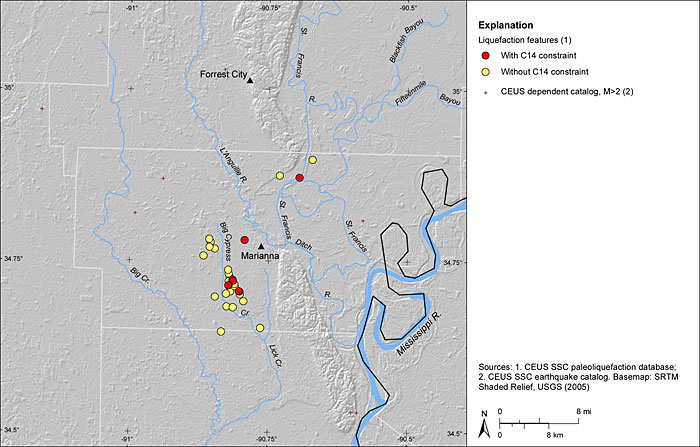
Figure E-16
GIS map of Marianna, Arkansas, area showing locations of liquefaction features that are thought to be historical or prehistoric in age or whose ages are poorly constrained. To date, no liquefaction features thought to have formed during 1811-1812 earthquakes have been found in area. Map projection is USA Contiguous Albers Equal Area Conic, North America Datum 1983
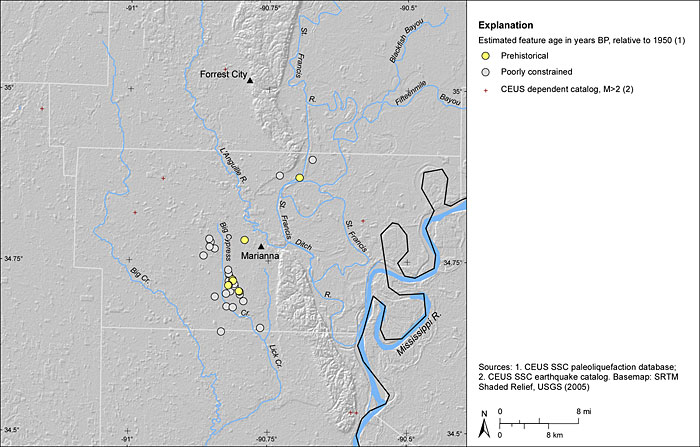
Figure E-17
GIS map of Marianna, Arkansas, area showing preferred age estimates of liquefaction features; features whose ages are poorly constrained are excluded. Map projection is USA Contiguous Albers Equal Area Conic, North America Datum 1983
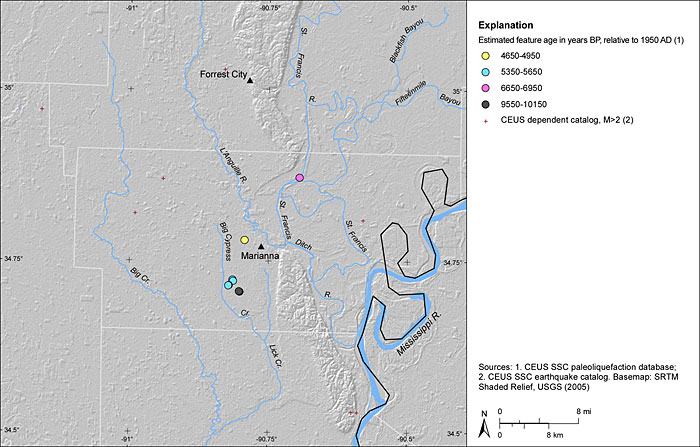
Figure E-18
GIS map of Marianna, Arkansas, area showing measured thicknesses of sand blows. Map projection is USA Contiguous Albers Equal Area Conic, North America Datum 1983
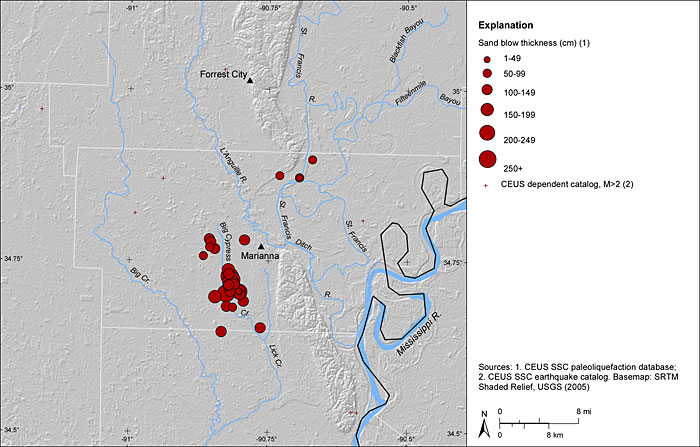
Figure E-19
GIS map of Marianna, Arkansas, area showing preferred age estimates and measured thicknesses of sand blows. Map projection is USA Contiguous Albers Equal Area Conic, North America Datum 1983
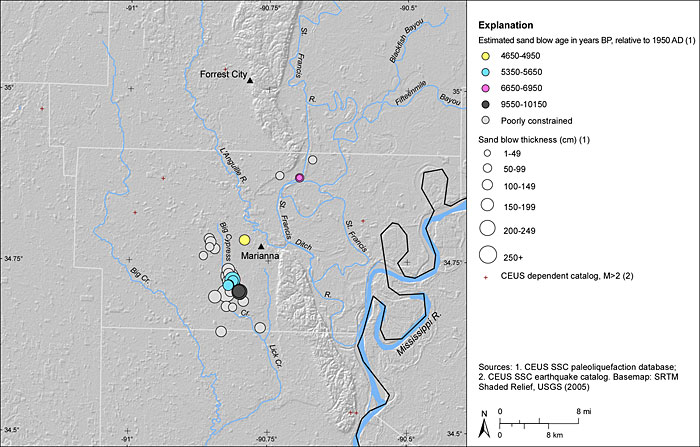
Figure E-20
GIS map of Marianna, Arkansas, area showing measured widths of sand dikes. Map projection is USA Contiguous Albers Equal Area Conic, North America Datum 1983
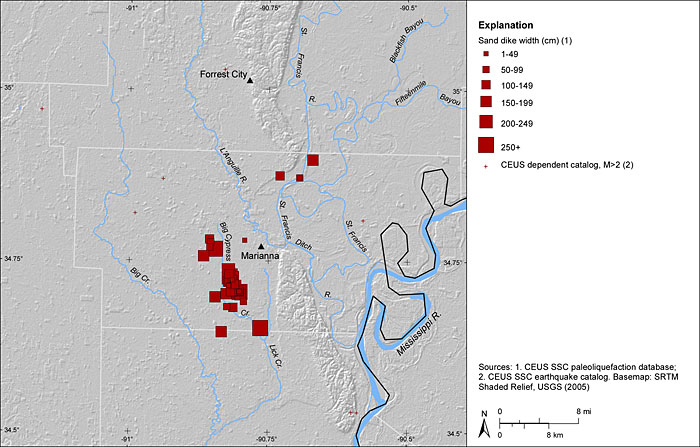
Figure E-21
GIS map of Marianna, Arkansas, area showing preferred age estimates and measured widths of sand dikes. Map projection is USA Contiguous Albers Equal Area Conic, North America Datum 1983
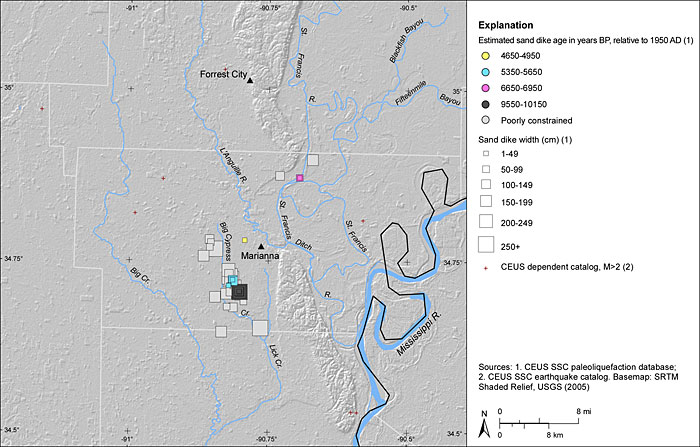
Figure E-22
GIS map of St. Louis, Missouri, region showing seismicity and portions of rivers searched for earthquake-induced liquefaction features by Tuttle and collaborators; information contributed for this report. Map projection is USA Contiguous Albers Equal Area Conic, North America Datum 1983
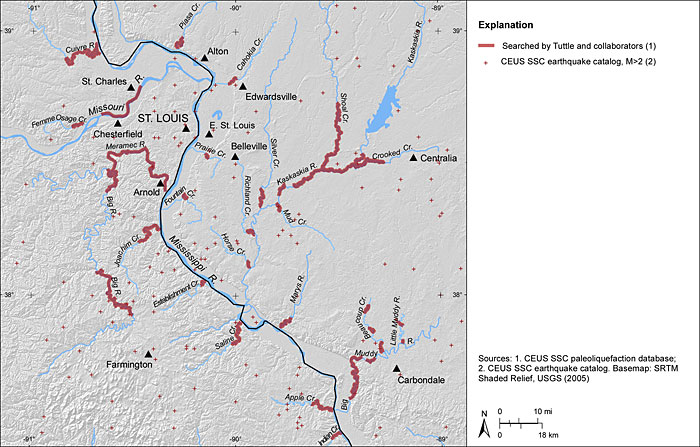
Figure E-23
GIS map of St. Louis, Missouri, region showing locations of liquefaction features, including several soft-sediment deformation structures, for which there are and are not radiocarbon data. Map projection is USA Contiguous Albers Equal Area Conic, North America Datum 1983
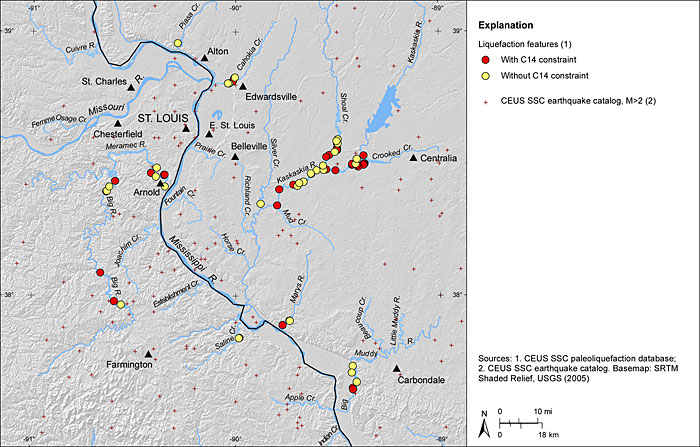
Figure E-24
GIS map of St. Louis, Missouri, region showing locations of liquefaction features that are thought to be historical or prehistoric in age or whose ages are poorly constrained. Map projection is USA Contiguous Albers Equal Area Conic, North America Datum 1983
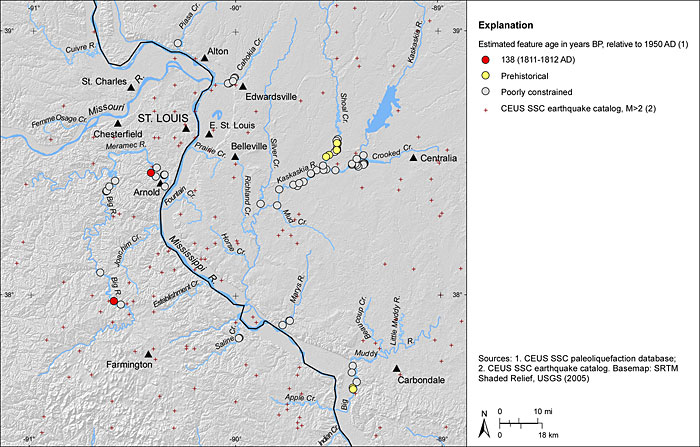
Figure E-25
GIS map of St. Louis, Missouri, region showing preferred age estimates of liquefaction features; features whose ages are poorly constrained, including several that are prehistoric in age, are not shown. Map projection is USA Contiguous Albers Equal Area Conic, North America Datum 1983

Figure E-26
GIS map of St. Louis, Missouri, region showing measured thicknesses of sand blows at similar scale as used in Figure E-8 of sand blows in New Madrid seismic zone. Note that few sand blows have been found in St. Louis region. Map projection is USA Contiguous Albers Equal Area Conic, North America Datum 1983
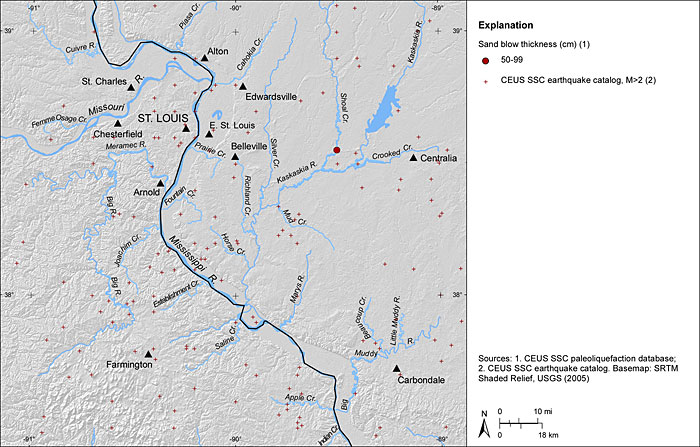
Figure E-27
GIS map of St. Louis, Missouri, region showing preferred age estimates and measured thicknesses of sand blows. Map projection is USA Contiguous Albers Equal Area Conic, North America Datum 1983

Figure E-28
GIS map of St. Louis, Missouri, region showing measured widths of sand dikes at similar scale as that used in Figure E-10 for sand dikes in New Madrid seismic zone. Map projection is USA Contiguous Albers Equal Area Conic, North America Datum 1983
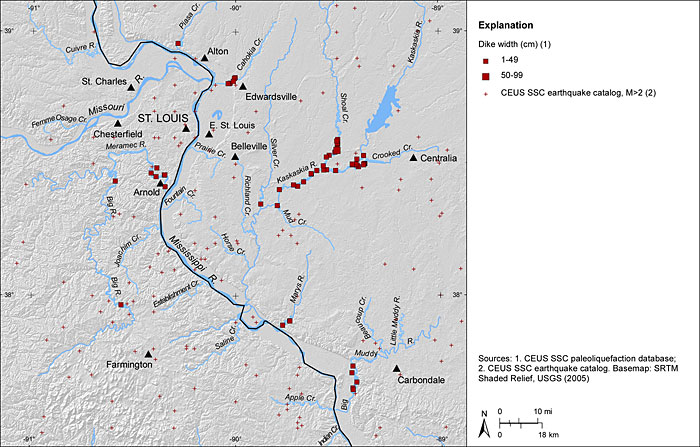
Figure E-29
GIS map of St. Louis, Missouri, region showing measured widths of sand dikes at similar scale as that used in Figures E-42 and E-48 for sand dikes in the Newburyport and Charlevoix regions, respectively. Map projection is USA Contiguous Albers Equal Area Conic, North America Datum 1983

Figure E-30
GIS map of St. Louis, Missouri, region showing preferred age estimates and measured widths of sand dikes. Map projection is USA Contiguous Albers Equal Area Conic, North America Datum 1983.
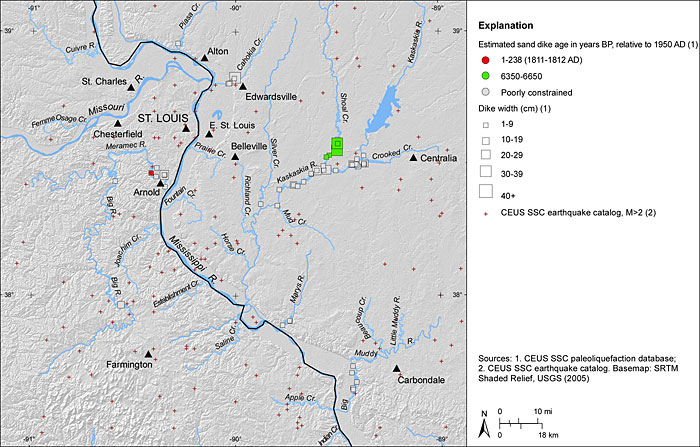
Figure E-31
GIS map of Wabash Valley seismic zone and surrounding region showing portions of rivers searched for earthquake-induced liquefaction features (digitized from McNulty and Obermeier, 1999). Map projection is USA Contiguous Albers Equal Area Conic, North America Datum 1983
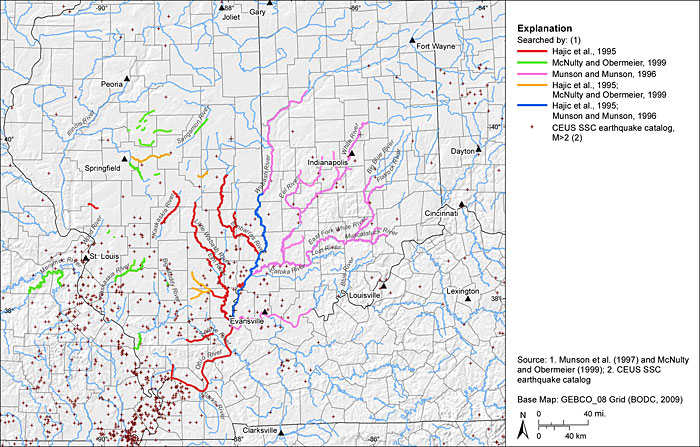
Figure E-32
GIS map of Wabash Valley seismic zone and surrounding region showing measured widths of sand dikes at similar scale as that used in Figures E-10 and E-11 for sand dikes in New Madrid seismic zone. Map projection is USA Contiguous Albers Equal Area Conic, North America Datum 1983
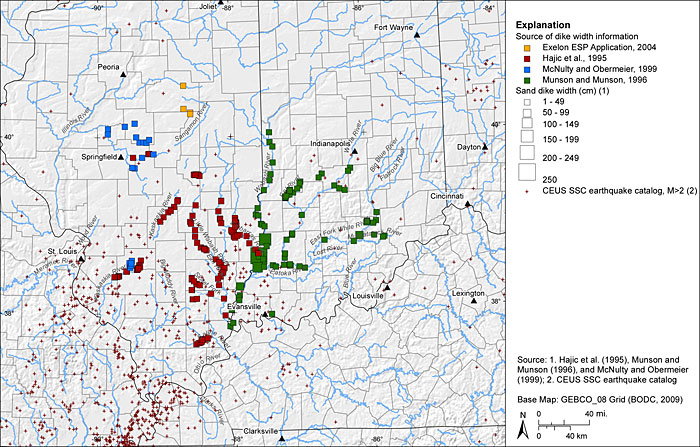
Figure E-33
GIS map of Wabash Valley region of Indiana and Illinois showing preferred age estimates and paleoearthquake interpretation. Map projection is USA Contiguous Albers Equal Area Conic, North America Datum 1983
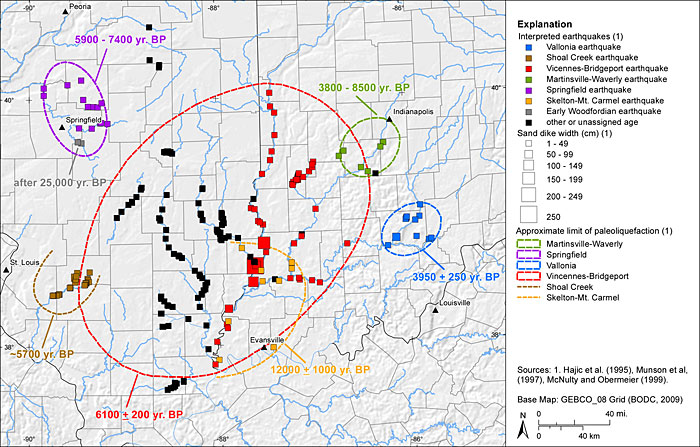
Figure E-34
GIS map of Arkansas-Louisiana-Mississippi (ALM) region showing paleoliquefaction study locations. Map projection is USA Contiguous Albers Equal Area Conic, North America Datum 1983
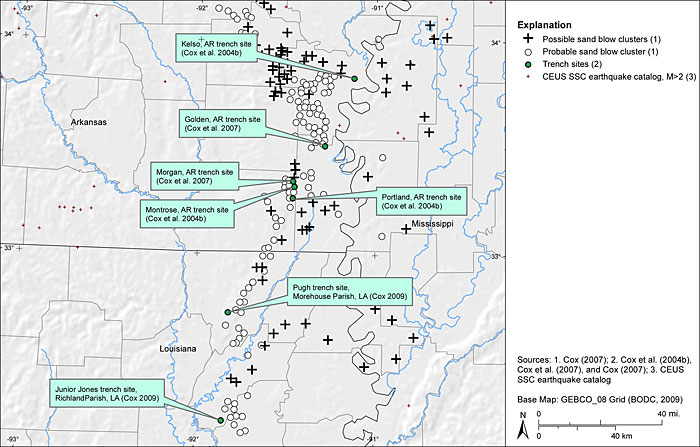
Figure E-35
GIS map of Charleston, South Carolina, region showing locations of paleoliquefaction features for which there are and are not radiocarbon dates. Map projection is USA Contiguous Albers Equal Area Conic, North America Datum 1983

Figure E-36
GIS map of Charleston, South Carolina, region showing locations of historical and prehistoric liquefaction features. Map projection is USA Contiguous Albers Equal Area Conic, North America Datum 1983
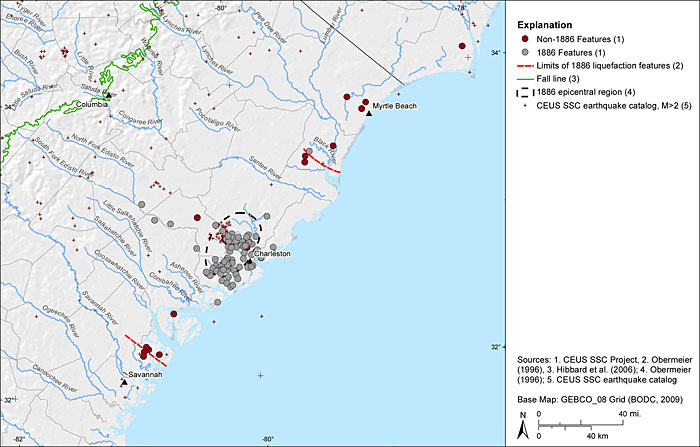
Figure E-37
Map of Atlantic coast region showing areas searched for paleoliquefaction features by Gelinas et al. (1998) and Amick, Gelinas, et al. (1990). Rectangles indicate 7.5-minute quadrangles in which sites were investigated for presence of paleoliquefaction features. The number of sites investigated is shown within that quadrangle, if known. Orange and yellow indicate quadrangles in which paleoliquefaction features were recognized
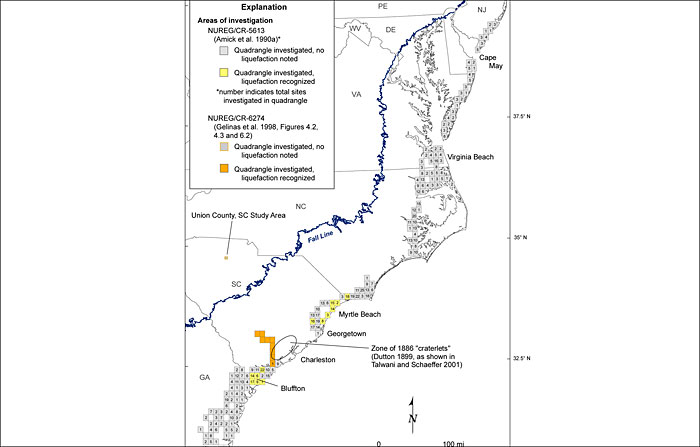
Figure E-38
Map of Central Virginia seismic zone region showing portions of rivers searched for earthquake-induced liquefaction features by Obermeier and McNulty (1998)
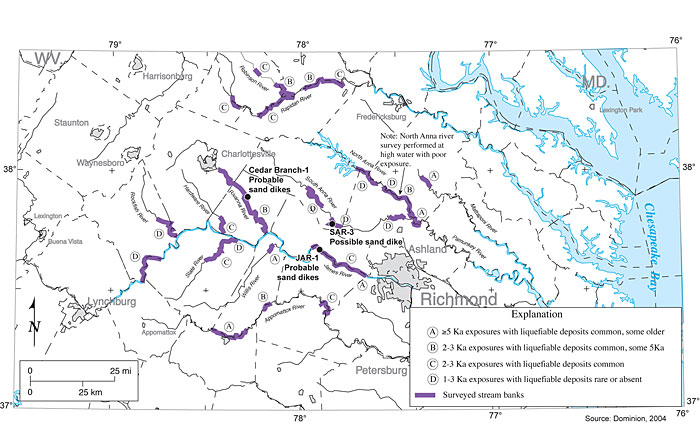
Figure E-39
GIS map of Newburyport, Massachusetts, and surrounding region showing seismicity and portions of rivers searched for earthquake-induced liquefaction features (Gelinas et al., 1998; Tuttle, 2007, 2009). Solid black line crossing map represents Massachusetts–New Hampshire border. Map projection is USA Contiguous Albers Equal Area Conic, North America Datum 1983
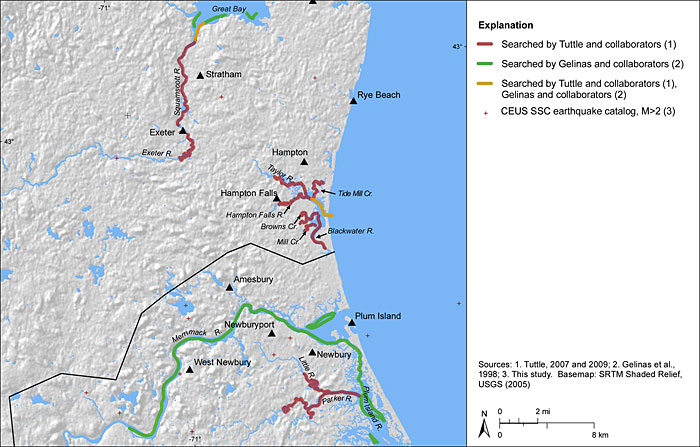
Figure E-40
GIS map of Newburyport, Massachusetts, and surrounding region showing locations of liquefaction features for which there are and are not radiocarbon dates. Map projection is USA Contiguous Albers Equal Area Conic, North America Datum 1983
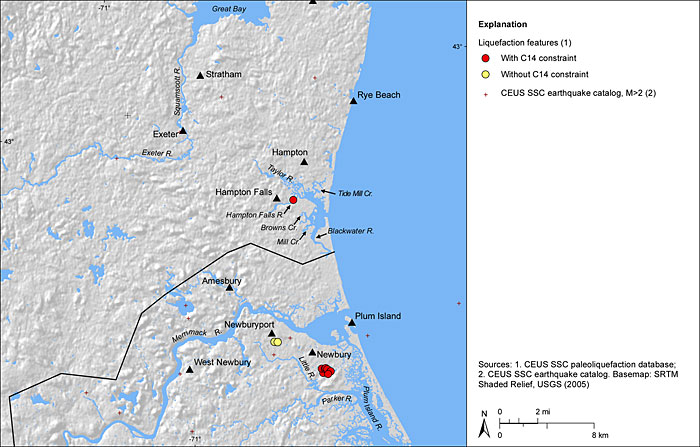
Figure E-41
GIS map of Newburyport, Massachusetts, and surrounding region showing locations of liquefaction features that are thought to be historical or prehistoric in age or whose ages are poorly constrained. Map projection is USA Contiguous Albers Equal Area Conic, North America Datum 1983
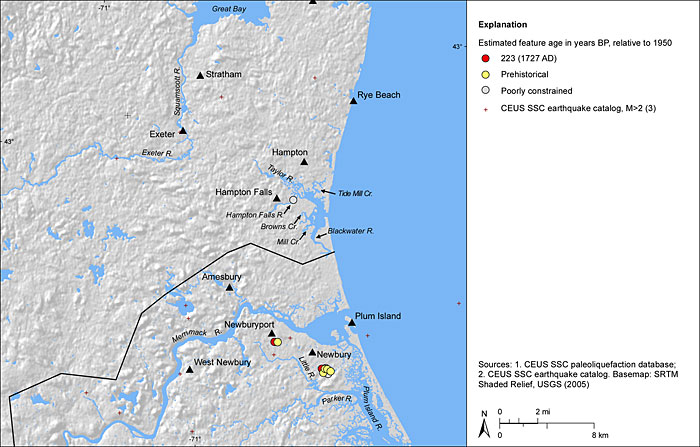
Figure E-42
GIS map of Newburyport, Massachusetts, and surrounding region showing measured widths of sand dikes. Map projection is USA Contiguous Albers Equal Area Conic, North America Datum 1983.
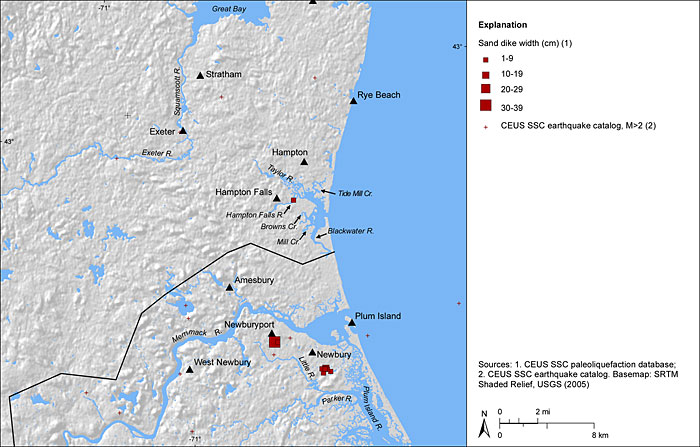
Figure E-43
GIS map of Newburyport, Massachusetts, and surrounding region showing preferred age estimates and measured widths of sand dikes. Map projection is USA Contiguous Albers Equal Area Conic, North America Datum 1983
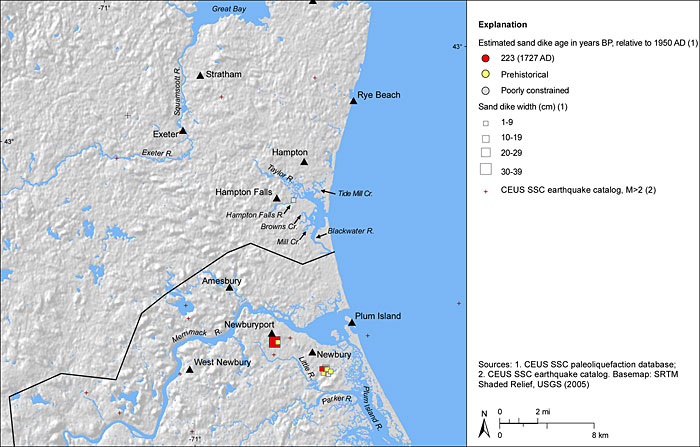
Figure E-44
Map of Charlevoix seismic zone and adjacent St. Lawrence Lowlands showing mapped faults and portions of rivers along which reconnaissance and searches for earthquake-induced liquefaction features were performed. Charlevoix seismic zone is defined by concentration of earthquakes and locations of historical earthquakes northeast of Quebec City. Devonian impact structure in vicinity of Charlevoix seismic zone is outlined by black dashed line. Laconic thrust faults are indicated by solid black lines with saw teeth on upper plate; Iapetan rift faults are shown by solid black lines with hachure marks on down thrown side (modified from Tuttle and Atkinson, 2010)
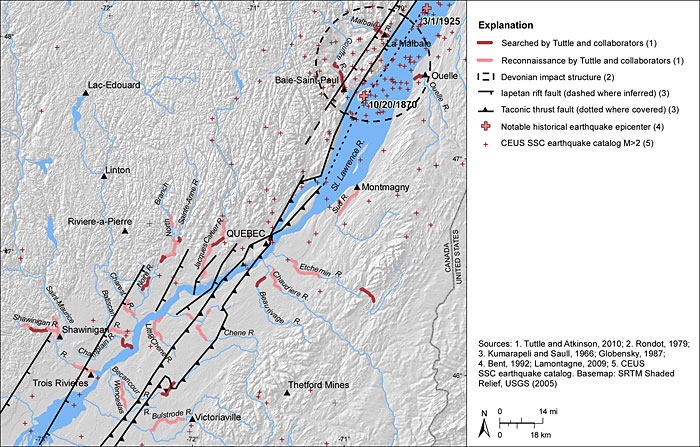
Figure E-45
GIS map of Charlevoix seismic zone and surrounding region showing locations of liquefaction features, including several soft-sediment deformation structures, for which there are and are not radiocarbon data. Note the location of 1988 M 5.9 Saguenay earthquake northwest of the Charlevoix seismic zone. Map projection is USA Contiguous Albers Equal Area Conic, North America Datum 1983
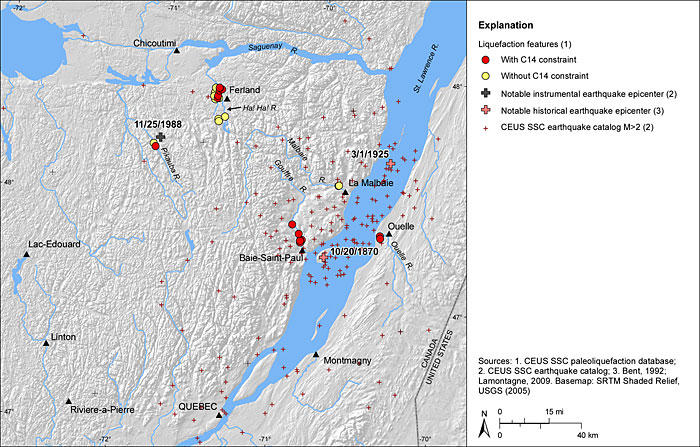
Figure E-46
GIS map of Charlevoix seismic zone and surrounding region showing locations of liquefaction features that are modern, historical, or prehistoric in age, or whose ages are poorly constrained. Map projection is USA Contiguous Albers Equal Area Conic, North America Datum 1983
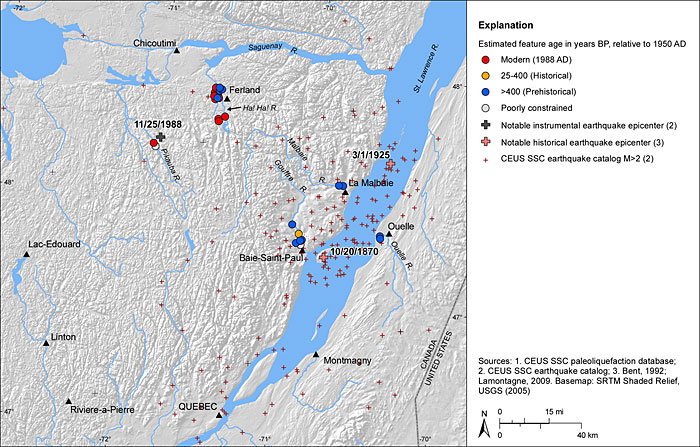
Figure E-47
GIS map of Charlevoix seismic zone and surrounding region showing preferred age estimates of liquefaction features; features whose ages are poorly constrained are excluded. Map projection is USA Contiguous Albers Equal Area Conic, North America Datum 1983
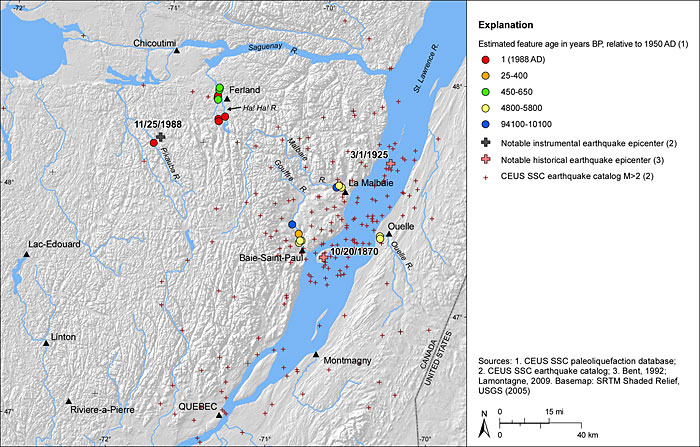
Figure E-48
GIS map of Charlevoix seismic zone and surrounding region showing measured widths of sand dikes. Map projection is USA Contiguous Albers Equal Area Conic, North America Datum 1983
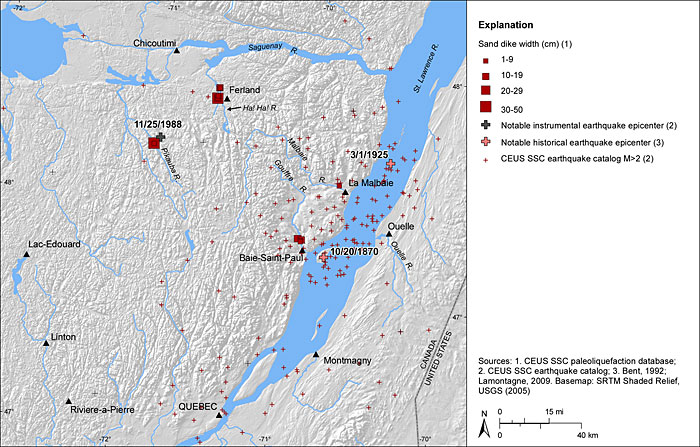
Figure E-49
GIS map of Charlevoix seismic zone and surrounding region showing preferred age estimates and measured widths of sand dikes. Map projection is USA Contiguous Albers Equal Area Conic, North America Datum 1983
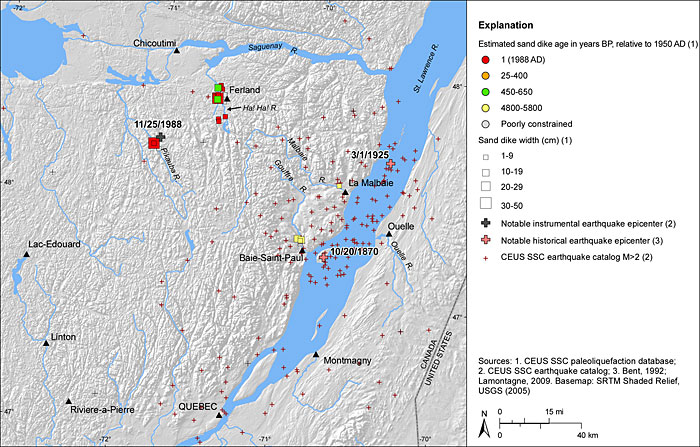
Figure E-50
Photograph of moderate-sized sand blow (12 m long, 7 m wide, and 14 cm thick) that formed about 40 km from epicenter of 2001 M 7.7 Bhuj, India, earthquake (from Tuttle, Hengesh, et al., 2002), combined with schematic vertical section illustrating structural and stratigraphic relations of sand blow, sand dike, and source layer (modified from Sims and Garvin, 1995)
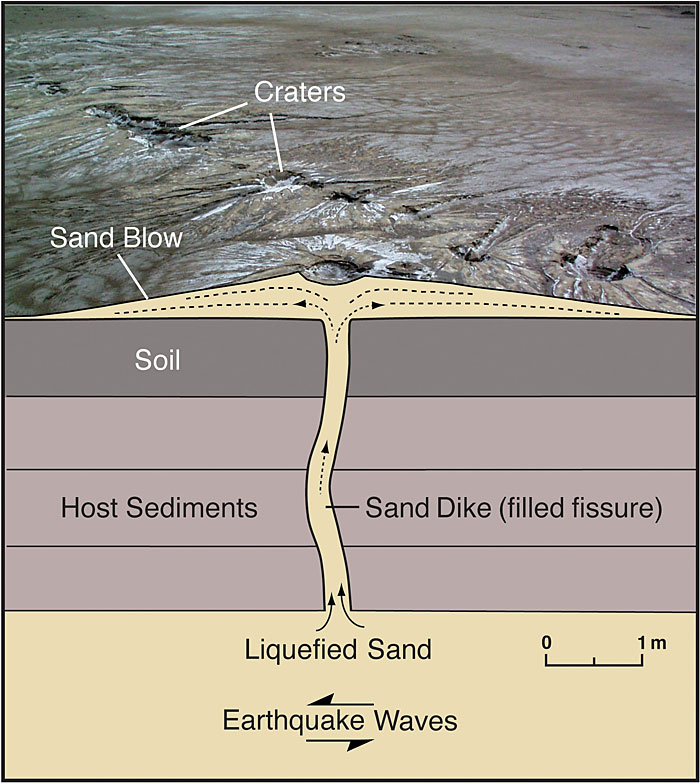
Figure E-51
Tree trunks buried and killed by sand blows, vented during 1811-1812 New Madrid earthquakes (from Fuller, 1912)
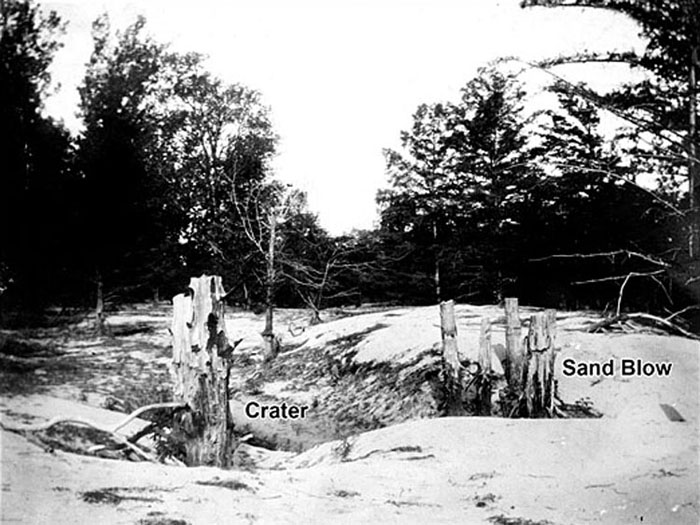
Figure E-52
Large sand-blow crater that formed during 2002 M 7.7 Bhuj, India, earthquake. Backpack for scale. Photograph: M. Tuttle (2001)
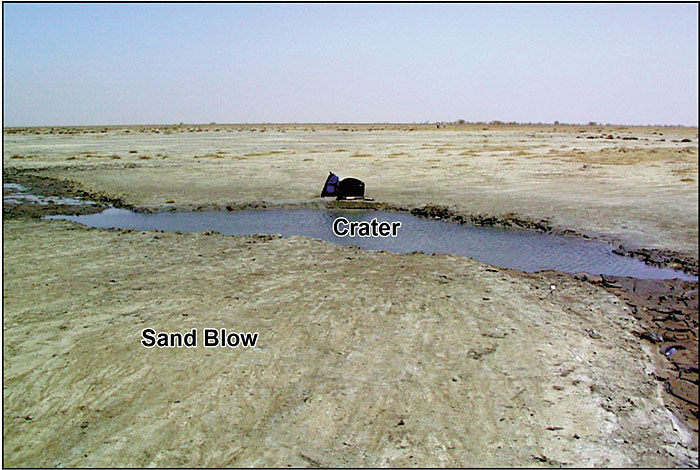
Figure E-53
Sand-blow crater that formed during 1886 Charleston, South Carolina, earthquake. Photograph: J.K. Hillers (from USGS Photograph Library)
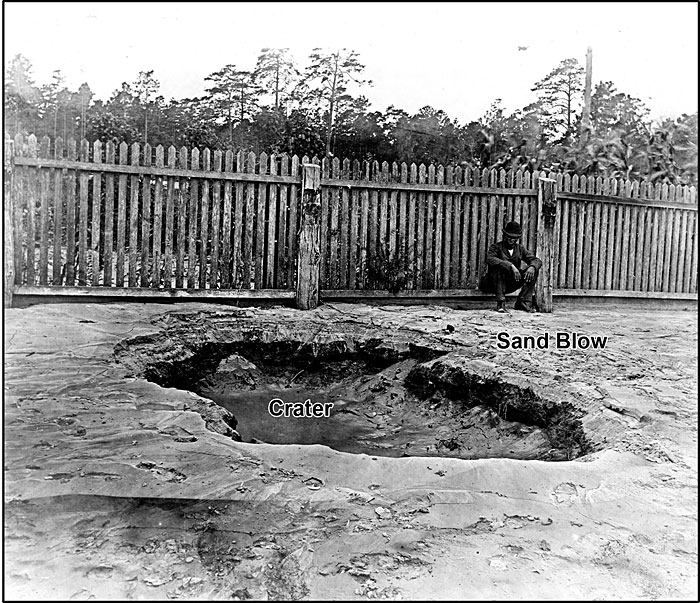
Figure E-54
Photograph of sand blow and related sand dikes exposed in trench wall and floor in New Madrid seismic zone. Buried soil horizon is displaced downward approximately 1 m across two dikes. Clasts of soil horizon occur within dikes and overlying sand blow. Degree of soil development above and within sand blow suggests that it is at least several hundred years old and formed prior to 1811-1812 New Madrid earthquakes. Organic sample (location marked by red flag) from crater fill will provide close minimum age constraint for formation of sand blow. For scale, each colored intervals on shovel handle represents 10 cm. Photograph: M. Tuttle
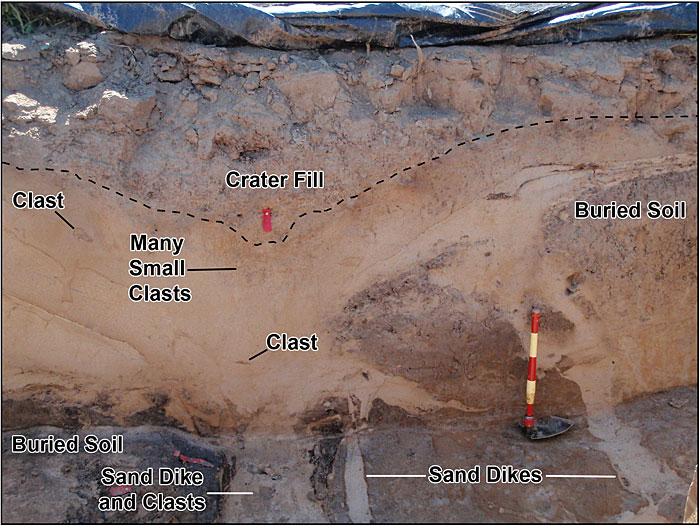
Figure E-55
Sand dikes, ranging up to 35 cm wide, originate in pebbly sand layer and intrude overlying diamicton, These features were exposed in cutbank along Cahokia Creek about 25 km northeast of downtown St. Louis (from Tuttle, 2000)
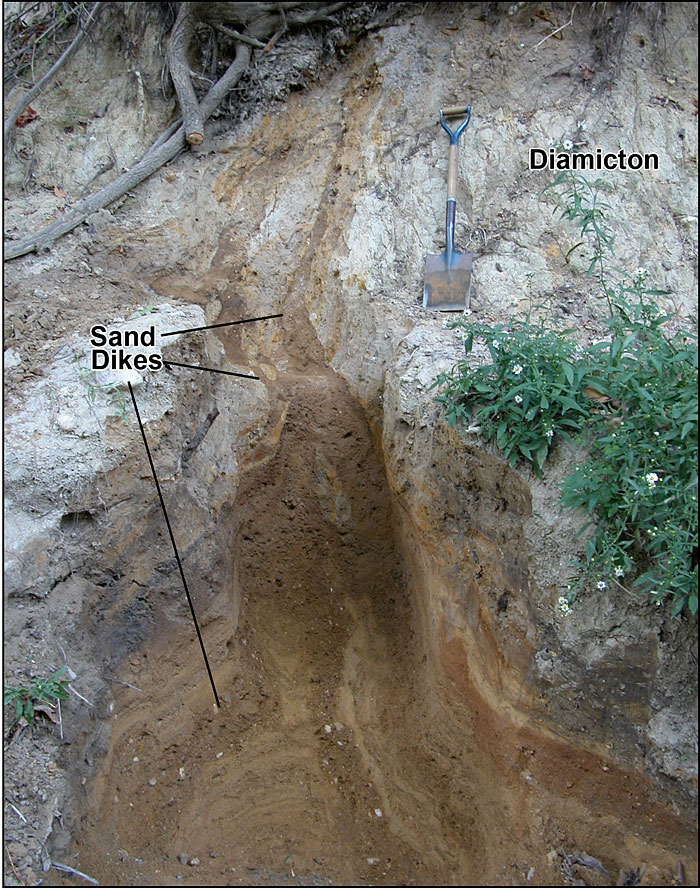
Figure E-56
Photograph of small diapirs of medium sand intruding base of overlying deposit of interbedded clayey silt and very fine sand, and clasts of clayey silt in underlying medium sand, observed along Ouelle River in Charlevoix seismic zone. Sand diapirs and clasts probably formed during basal erosion and foundering of clayey silt due to liquefaction of the underlying sandy deposit. Red portion of shovel handle represents 10 cm (modified from Tuttle and Atkinson, 2010)
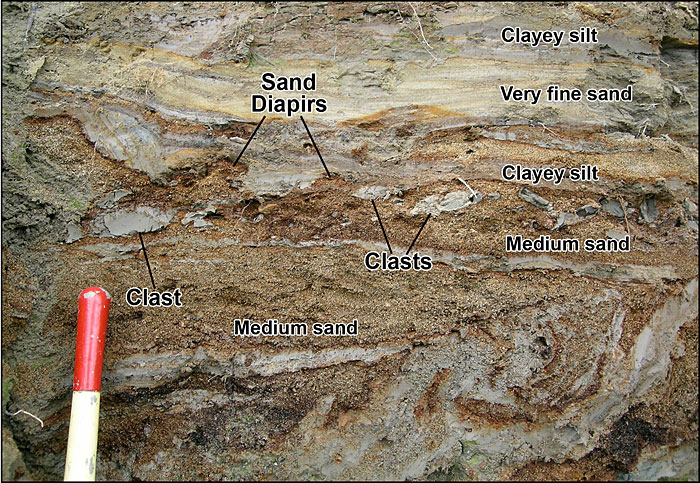
Figures E-57
(A) Load cast formed in laminated sediments of Van Norman Lake during 1952 Kern County, California, earthquake. Photograph: J. Sims (from Sims, 1975). (B) Load cast, pseudonodules, and related folds formed in laminated sediment exposed along Malbaie River in Charlevoix seismic zone. Sand dikes crosscutting these same laminated sediments occur at a nearby site. For scale, each painted interval of the shovel handle represents 10 cm (modified from Tuttle and Atkinson, 2010)

Figure E-58
Log of sand blow and uppermost portions of related sand dikes exposed in trench wall at Dodd site in New Madrid seismic zone. Sand dikes were also observed in opposite wall and trench floor. Sand blow buries pre-event A horizon, and a subsequent A horizon has developed in top of sand blow. Radiocarbon dating of samples collected above and below sand blow brackets its age between 490 and 660 yr BP. Artifact assemblage indicates that sand blow formed during late Mississippian (300–550 yr BP or AD 1400–1670) (modified from Tuttle, Collier, et al., 1999)

Figures E-59
(A) Photograph of earthquake-induced liquefaction features found in association with cultural horizon and pit exposed in trench wall near Blytheville, Arkansas, in New Madrid seismic zone. Photograph: M. Tuttle. (B) Trench log of features shown in (A). Sand dike formed in thick Native American occupation horizon containing artifacts of early Mississippian cultural period (950–1,150 yr BP). Cultural pit dug into top of sand dike contains artifacts and charcoal used to constrain minimum age of liquefaction features (modified from Tuttle and Schweig, 1995)
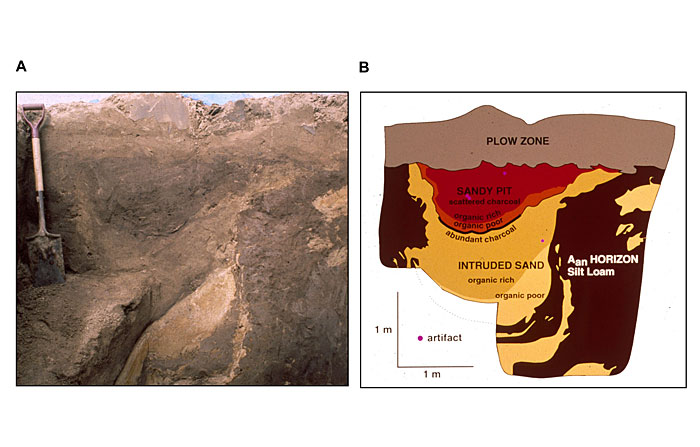
Figure E-60
In situ tree trunks such as this one buried and killed by sand blow in New Madrid seismic zone offer opportunity to date paleoearthquakes to the year and season of occurrence. Photograph: M. Tuttle
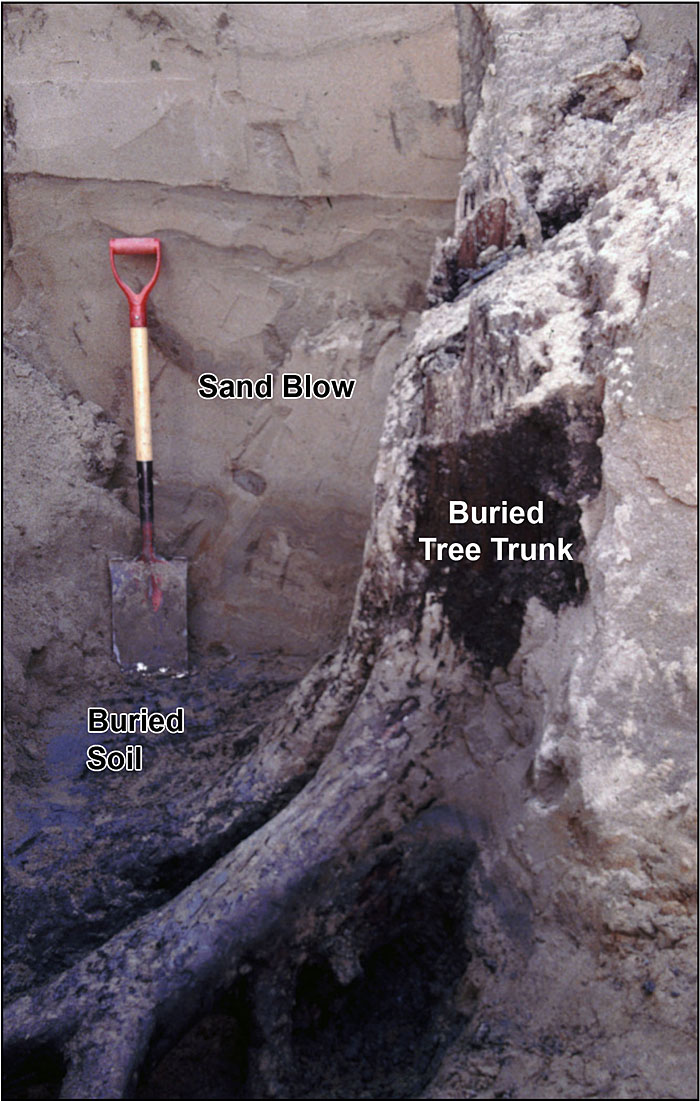
Figure E-61
Portion of dendrocalibration curve illustrating conversion of radiocarbon age to calibrated date in calendar years. In example, 2-sigma radiocarbon age of 2,280–2,520 BP is converted to calibrated date of 770–380 BC (from Tuttle, 1999)

Figure E-62
Empirical relation developed between A horizon thickness of sand blows and years of soil development in New Madrid region. Horizontal bars reflect uncertainties in age estimates of liquefaction features; diamonds mark midpoints of possible age ranges (from Tuttle et al., 2000)

Figure E-63
Diagram illustrating earthquake chronology for New Madrid seismic zone for past 5,500 years based on dating and correlation of liquefaction features at sites (listed at top) across region from north to south. Vertical bars represent age estimates of individual sand blows, and horizontal bars represent event times of 138 yr BP (AD 1811-1812); 500 yr BP ± 150 yr; 1,050 yr BP ± 100 yr; and 4,300 yr BP ± 200 yr (modified from Tuttle, Schweig, et al., 2002; Tuttle et al., 2005)
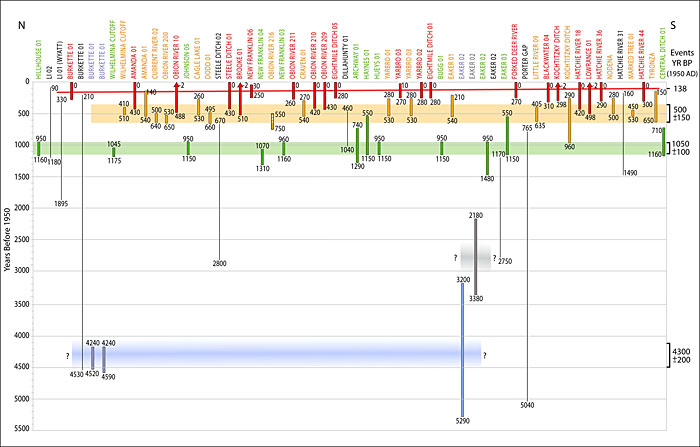
Figure E-64
Diagram illustrating earthquake chronology for New Madrid seismic zone for past 2,000 years, similar to upper portion of diagram shown in Figure E-63. As in Figure E-63, vertical bars represent age estimates of individual sand blows, and horizontal bars represent event times. Analysis performed during CEUS-SSC Project derived two possible uncertainty ranges for timing of paleoearthquakes, illustrated by the darker and lighter portions of the colored horizontal bars, respectively: 503 yr BP ± 8 yr or 465 yr BP ± 65 yr, and 1,110 yr BP ± 40 yr or 1055 ± 95 yr (modified from Tuttle, Schweig, et al., 2002)
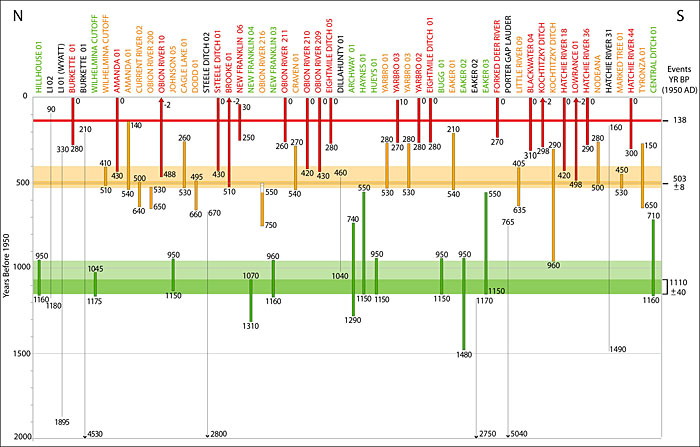
Figure E-65
Maps showing spatial distributions and sizes of sand blows and sand dikes attributed to 500 and 1,050 yr BP events. Locations and sizes of liquefaction features that formed during AD 1811-1812 (138 yr BP) New Madrid earthquake sequence shown for comparison (modified from Tuttle, Schweig, et al., 2002)
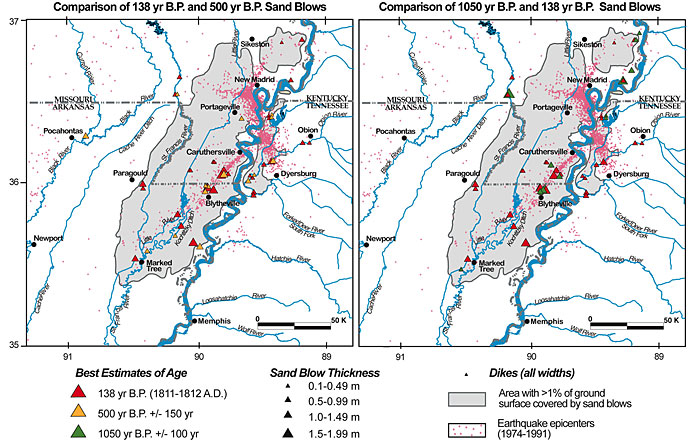
Figure E-66
Liquefaction fields for 138 yr BP (AD 1811-1812); 500 yr BP (AD 1450); and 1,050 yr BP (AD 900) events as interpreted from spatial distribution and stratigraphy of sand blows (modified from Tuttle, Schweig, et al., 2002). Ellipses define areas where similar-age sand blows have been mapped. Overlapping ellipses indicate areas where sand blows are composed of multiple units that formed during sequence of earthquakes. Dashed ellipse outlines area where historical sand blows are composed of four depositional units. Magnitudes of earthquakes in 500 yr BP and 1,050 yr BP are inferred from comparison with 1811-1812 liquefaction fields. Magnitude estimates of December (D), January (J), and February (F) main shocks and large aftershocks taken from several sources; rupture scenario from Johnston and Schweig (1996; modified from Tuttle, Schweig, et al., 2002)
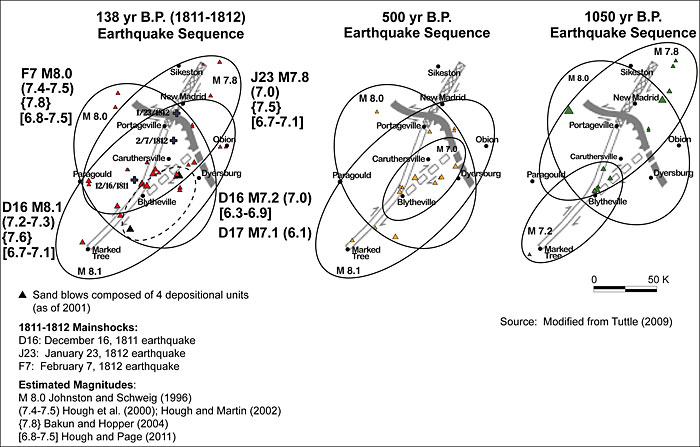
Figure E-67
Empirical relation between earthquake magnitude and epicentral distance to farthest known sand blows induced by instrumentally recorded earthquakes (modified from Castilla and Audemard, 2007)
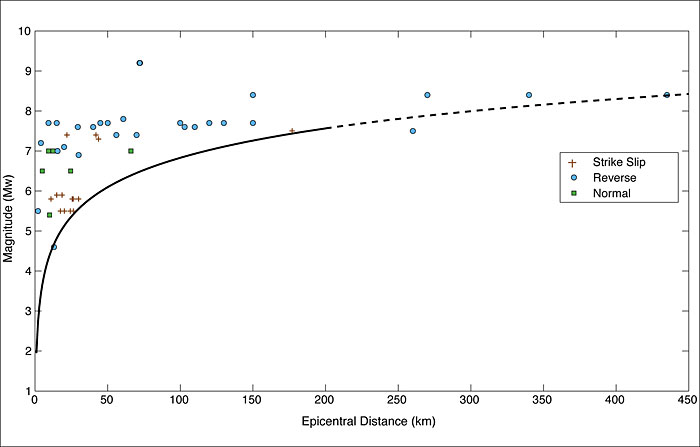
Figure E-68
Distances to farthest known liquefaction features indicate that 500 and 1,050 yr BP New Madrid events were at least of M 6.7 and 6.9, respectively, when plotted on Ambraseys (1988) relation between earthquake magnitude and epicentral distance to farthest surface expression of liquefaction. Similarity in size distribution of historical and prehistoric sand blows, however, suggests that paleoearthquakes were comparable in magnitude to 1811-1812 events or M ~7.6 (modified from Tuttle, 2001)
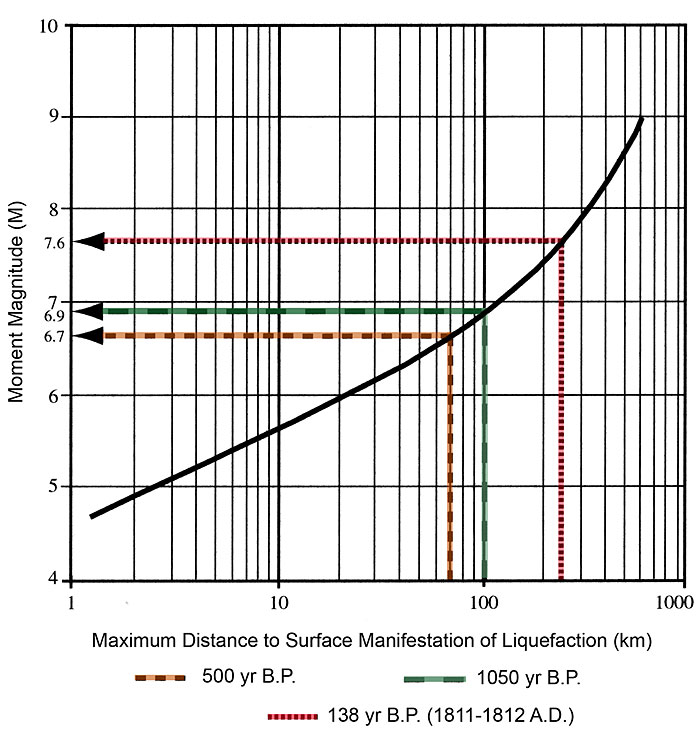
Ball-and-pillow structures. Deformation structures that form when lobes of sediment sink into underlying sediment forming isolated masses that resemble balls and pillows.
Basal erosion. Foundering of the base on a sedimentary unit due to liquefaction and loss of strength of the underlying sediment.
Bearing capacity. The ability of soil or sediment to carry a load without failing.
Close maximum constraining age. Maximum possible age derived by dating material collected immediately below a feature of interest that nearly approximates its age.
Close minimum constraining age. Minimum possible age derived by dating material collected immediately above a feature of interest that nearly approximates its age.
Consistence. Term describing a soil’s ability to resist crushing and to be molded.
Contemporary age. An age that reflects the formation of the deposit from which the dated sample was collected.
Convolute bedding. Contorted bedding usually confined to a single sedimentary unit.
Dendrocalibration curve. Relation used to convert radiocarbon ages to calendar ages based on radiocarbon dating of tree rings of known ages.
Dessication crack. Crack in clayey sediment that forms by shrinkage as the result of drying.
Dish structures. Deformation structures consisting of flat to concave upward laminations caused by liquefaction and fluidization of sediment and commonly associated with pillars.
Earthquake recurrence. The repetition of a similar magnitude earthquake generated by the same fault or source zone.
Effective stress or overburden pressure. The portion of the load or force from overlying material that is supported by the soil or sediment grains.
Eustacy. Of, or pertaining to, worldwide sea level.
Flow lineation. Lineation in sediment related to liquefaction and fluidization of sediment.
Fluidization. Process by which vertical fluid flow through sediment exerts sufficient drag force on the grains to lift or suspend them against the force of gravity.
Glacio-isostacy. Lithospheric adjustment in response to the weight or melting of glaciers.
Holocene. The most recent geologic epoch, following the last glaciation, known as the Wisconsin in North America and beginning about 12,000 years BP.
Liquefaction. A process by which saturated, granular sediment temporarily loses its strength and behaves as a viscous liquid due to earthquake ground shaking
Liquefaction field. The area over which liquefaction features form during a particular earthquake.
Load structure. A deformation structure that forms when sediment sinks into underlying sediment that has lost its strength in some cases due to liquefaction.
Magnitude-bound. Relation defining the lowest magnitude at which liquefaction is likely to occur at any given epicentral distance.
Maximum constraining age. Maximum possible age derived by dating material collected stratigraphically below a feature of interest.
Minimum constraining age. Minimum possible age derived by dating material collected stratigraphically above a feature of interest.
Optically simulated luminescence (OSL). Dating technique used to determine the amount of time that has passed since sediment was last exposed to light (see Section E.2.1.3.3).
Penetration resistance. Measure of soil or sediment density expressed as N or the number of hammer blows it takes to drive a split-tube sampler 12 inches.
pH. Measure of acidity of an aqueous solution and is related to the negative logarithm of the concentration of hydrogen ions and their tendency to interact with other components of the solution.
Pillars. Deformation structures including tubular to sheet-like zones of structureless to swirled sediment that form during forceful and explosive water escape.
Pleistocene. The earlier of the two geologic epochs comprising the Quaternary; characterized by multiple glaciations.
Pore-water pressure. The water pressure within the voids or spaces between soil or sediment grains.
Pseudonodule. A deformation structure similar to a load structure except that the sediment that sinks into underlying sediment becomes detached to form separate bodies or domains.
Quaternary. The youngest geologic period beginning about 2.6 million years ago; subdivided into Pleistocene and Holocene epochs.
Relative density. The relation between the actual void ratio and the maximum and minimum void ratios of a soil or sediment.
Sand blow. Deposit resulting from liquefaction and fluidization of subsurface sandy sediment and expulsion of liquefied sediment onto the ground surface.
Sand dike. Intrusive sand body, often tabular in shape, resulting from liquefaction and fluidization of subsurface sandy sediment and injection of liquefied sediment into overlying deposits.
Sand diapir. A small, sandy intrusion into overlying, usually fine-grained, sediment.
Soft-sediment deformation structures. A variety of structures, including sand diapirs, basal erosion, convolute bedding, pseudonodules, and load casts, that form in unconsolidated sediments as the result of deformation ranging from bulk transport of the sediment mass to in situ relative grain displacement.
Soil structure. The arrangement of primary soil particles into secondary units known as pedons.
Space-time diagram. Diagram showing variations in some parameter over space and time.
Void ratio. The ratio of the volume of voids, or space between grains, to the volume of solids in a soil or sediment.
Wisconsin. The last glacial age of the Pleistocene epoch of North America.
E.5.1 References Cited in Paleoliquefaction Database
Amick, D., Gelinas, R., Maurath, G., Cannon, R., Moore, D., Billington, E., and Kemppinen, H., 1990, Paleoliquefaction features along the Atlantic Seaboard: U.S. Nuclear Regulatory Commission Report, NUREG/CR-5613.
Amick, D., Maurath, G., and Gelinas, R., 1990, Characteristics of Seismically Induced Liquefaction Sites and Features Located in the Vicinity of the 1886 Charleston, South Carolina Earthquake: Seismological Research Letters, v. 61, no. 2, pp. 117-130.
Barnes, A. A., 2000, An interdisciplinary study of earthquake-induced liquefaction features in the New Madrid seismic zone, central United States: M.S. thesis, Auburn University, Alabama, 266 p.
Bauer, L. M., 2006, Studies of Historic and Prehistoric Earthquake-induced Liquefaction Features in the Meizoseismal Area of the 1811-1812 New Madrid Earthquakes, Central United States: M.S. thesis, University of Memphis, Memphis, Tennessee, p. 135.
Broughton, A. T., Van Arsdale, R. B., and Broughton, J. H., 2001, Liquefaction susceptibility mapping in the city of Memphis and Shelby County, Tennessee (in Earthquake hazard evaluation in the central United States): Engineering Geology, v. 62 (1-3), pp. 207-222.
Browning, S. E., 2003, Paleoseismic studies in the New Madrid Seismic Zone, Central United States: M.S. thesis, Auburn University, Auburn, Alabama, 134 p.
Buchner, C. A., Cox, R., Skinner, C. T., Kaplan, C., and Albertson, E. S., 2010, Data recovery excavations at the Laplant I Site (23NM51), New Madrid County, Missouri: Report to U.S. Army Corps of Engineers, Memphis District.
Collier, J. W., 1998, Geophysical investigations of liquefaction features in the New Madrid seismic zone: Northeastern Arkansas and southeastern Missouri: M.S. thesis, Auburn University, Auburn, Alabama, 163 p.
Cox, R. T., Van Arsdale, R. B., Harris, J. B., and Larsen, D., 2001, Neotectonics of the southeastern Reelfoot rift zone margin, central United States, and implications for regional strain accommodation: Geology, v. 29, pp. 419-422.
Cox, R.T., Larsen, D., Forman, S.L., Woods, J., Morat, J., Galluzzi, J., 2004, Preliminary assessment of sand blows in the southern Mississippi Embayment: Bulletin of the Seismological Society of America, v. 94, no. 3, pp. 1125-1142.
Cox, R. T., Cherryhomes, J., Harris, J. B., Larsen, D., Van Arsdale, R. B., and Forman, S. L., 2006, Paleoseismology of the southeastern Reelfoot rift in western Tennessee, U.S.A. and implications for intraplate fault zone evolution: Tectonics, v. 25, TC3019, doi:10.1029/2005TC001829, 17 p.
Cox, R. T., Hill, A. A., Larsen, D., Holzer, T., Forman, S. L., Noce, T., Gardner, C., and Morat, J., 2007, Seismotectonic implications of sand blows in the southern Mississippi Embayment, Engineering Geology, v. 89, pp. 278-299.
Craven, J. A., 1995a, Paleoseismological Study in the New Madrid Seismic Zone Using Geological and Archeological Features to Constrain Ages of Liquefaction Deposits: M.S. thesis, University of Memphis, 51 pp.
Craven, J. A., 1995b, Evidence of paleoseismicity within the New Madrid seismic zone at a late Mississipian Indian occupation site in the Missouri Bootheel: Geological Society of America, Abstracts with Programs, 1995 Annual Meeting, p. A-394.
Dominion Nuclear North Anna, LLC (Dominion), 2004, North Anna Early Site Permit Application, Response to Request for Additional Information No. 3, Nuclear Regulatory Commission Accession Number ML042800292, July 8.
Exelon Generation Company, 2004, Clinton Early Site Permit Application, Response to Request for Additional Information Letter No. 7, October 11.
Gassman, S., Talwani, P., and Hasek, M., 2009, Maximum Magnitudes of Charleston, South Carolina Earthquakes from In-Situ Geotechnical Data: Abstracts Volume from Meeting of Central and Eastern U.S. Earthquake Hazards Program, University of Memphis, Memphis, TN, October 28-29, p. 19.
Green, R. A., Obermeier, S. F., and Olson, S. M., 2005, Engineering geologic and geotechnical analysis of paleoseismic shaking using liquefaction effects: Field examples: Engineering Geology, v. 76, pp. 263-293.
Hajic, E. R., Wiant, M. D., and Oliver, J. J., 1995, Distribution and dating of prehistoric earthquake liquefaction in southeastern Illinois, central U.S.: National Earthquake Hazards Reduction Program, Final Technical Report, Agreement No. 1434-93-G-2359, 34 pp.
Hu, K., Gassman, S. L., and Talwani, P., 2002a, In-situ properties of soils at paleoliquefaction sites in the South Carolina coastal plain: Seismological Research Letters, v. 73, no. 6, pp. 964-978.
Hu, K., Gassman, S. L., and Talwani, P., 2002b, Magnitudes of prehistoric earthquakes in the South Carolina coastal plain from geotechnical data: Seismological Research Letters, v. 73, no. 6, pp. 979-991.
Law, K.T., 1990, Analysis of soil liquefaction during the 1988 Saguenay earthquake: Proceedings of the 43rd Canadian Geotechnical Conference, Quebec, v. 1, pp. 189-196.
Leon, E., 2003, Effect of Aging of Sediments on Paleoliquefaction Evaluation in the South Carolina Coastal Plain: unpublished Ph.D. dissertation, University of South Carolina, 181 pp.
Leon, E., Gassman, S. L., and Talwani, P., 2005, Effect of soil aging on assessing magnitudes and accelerations of prehistoric earthquakes: Earthquake Spectra, v. 21, no. 3, pp. 737-759.
Li, Y., Schweig, E. S., Tuttle, M. P., and Ellis, M. A., 1998, Evidence for large prehistoric earthquakes in the northern New Madrid seismic zone, central United States: Seismological Research Letters, v. 69, no. 3, pp. 270-276.
Liao, T., Mayne, P. W., Tuttle, M. P., Schweig, E. S., and Van Arsdale, R. B., 2002, CPT site characterization for seismic hazards in the New Madrid seismic zone: Soil Dynamics and Earthquake Engineering, v. 22, pp. 943-950.
Mayne, P. W., 2001, Cone penetration testing for seismic hazards evaluation in Memphis and Shelby County, Tennessee, U.S. Geological Survey, Earthquake Hazards Program, Final Report (00HQGR0025), 21 pp.
McNulty, W. E. and Obermeier, S. F., 1999, Liquefaction Evidence for at Least Two Strong Holocene Paleo-Earthquakes in Central and Southwestern Illinois, USA: Environmental and Engineering Geoscience, v. V, no. 2, pp. 133-146.
Munson, P. J. and Munson, C. A., 1996, Paleoliquefaction Evidence for Recurrent Strong Earthquakes Since 20,000 Years BP in the Wabash Valley Area of Indiana, report submitted to the U.S. Geological Survey in fulfillment of National Earthquake Hazards Reduction Program Grant No. 14-08-0001-G2117, 137 pp.
Munson, P. J., Obermeier, S. F., Munson, C. A., and Hajic, E. R., 1997, Liquefaction evidence for Holocene and latest Pleistocene seismicity in the southern halves of Indiana and Illinois: A preliminary overview: Seismological Research Letters, v. 68, pp. 521-536.
Noller, J. S. and Forman, S. L., 1998, Luminescence Geochronology of Liquefaction Features Near Georgetown, South Carolina: in J.M. Sowers, J.S. Noller, and W.R. Lettis (eds.) Dating and Earthquakes: Review of Quaternary Geochronology and Its Application to Paleoseismology: U.S. Nuclear Regulatory Commission Report, NUREG/CR-5562, pp. 4.494.57.
Obermeier, S. F., 1998, Liquefaction evidence for strong earthquakes of Holocene and latest Pleistocene ages in the states of Indiana and Illinois, USA: Engineering Geology, v. 50, pp. 227-254.
Olson, S. M., Green, R. A., and Obermeier, S. F., 2005b, Revised magnitude bound relation for the Wabash Valley seismic zone of the central United States: Seismological Research Letters, v. 76, no. 6, pp. 756-771.
Pond, E. C., and Martin, J. R., 1997, Estimated magnitudes and accelerations associated with prehistoric earthquakes in the Wabash Valley region of the central United States: in Kolata, D. R., and Hildenbrand, T. G. (editors), Investigations of the Illinois Basin Earthquake Region: Seismological Research Letters, v. 68, pp. 611-623.
Al-Qadhi, O., 2010, Geophysical investigation of paleoseismological features in eastern Arkansas, USA: Ph.D. Dissertation, University of Arkansas at Little Rock, p. 277.
Saucier, R. T., 1991, Geoarchaeological evidence of strong prehistoric earthquakes in the New Madrid (Missouri) seismic zone: Geology, v. 19, pp. 296-298.
Al-Shukri, H., Lemmer, R. E., Mahdi, H. H., and Connelly, J. B., 2005, Spatial and temporal characteristics of paleoseismic features in the southern terminus of the New Madrid seismic zone in eastern Arkansas: Seismological Research Letters, v. 76, no. 4, pp. 502-511.
Al-Shukri, H., Mahdi, H., Al Kadi, O., and Tuttle, M. P., 2009, Spatial and Temporal Characteristics of Paleoseismic Features in the Southern Terminus of the New Madrid Seismic Zone in Eastern Arkansas: Final Technical Report to U.S. Geological Survey, 24 pp.
Talwani, P., Amick, D. C., and Schaeffer, W. T., 1999, Paleoliquefaction Studies in the South Carolina Coastal Plain: U.S. Nuclear Regulatory Commission Report NUREG/CR 6619, 109 pp.
Talwani, P., and Cox, J., 1985, Paleoseismic evidence for recurrence of earthquakes Near Charleston, South Carolina: Science, v. 228, pp. 379-381.
Talwani, P., Dura-Gomez, I., Gassman, S., Hasek, M., and Chapman, A., 2008, Studies related to the discovery of a prehistoric sandblow in the epicentral area of the 1886 Charleston SC earthquake: Trenching and geotechnical investigations: Program and Abstracts, Eastern Section of the Seismological Society of America, p. 50.
Talwani, P., Rajendran, C. P., Rajendran, K., and Madabhushi, S., 1993, Assessment of Seismic Hazard Associated with Earthquake Source in the Bluffton-Hilton Head Area: Technical Report SCUREF Task Order 41, University of South Carolina at Columbia, 85 pp.
Talwani, P., and Schaeffer, W. T., 2001, Recurrence rates of large earthquakes in the South Carolina coastal plain based on paleoliquefaction data: Journal of Geophysical Research, v. 106, no. B4, pp. 6621-6642.
Tuttle, M.P., 1994, The Liquefaction Method for Assessing Paleoseismicity, U.S. Nuclear Regulatory Commission, NUREG/CR-6258, 38 pp.
Tuttle, M. P., 1999, Late Holocene Earthquakes and Their Implications for Earthquake Potential of the New Madrid Seismic Zone, Central United States: Ph.D. dissertation, University of Maryland, College Park, Maryland, 250 pp.
Tuttle, M. P., 2000, Paleoseismological Study in the St. Louis Region: U.S. Geological Survey, Earthquake Hazards Program, Final Technical Report (99HQGR0032), 29 pp.
Tuttle, M. P., 2005, Improving the Earthquake Chronology for the St. Louis Region: U.S. Geological Survey, Earthquake Hazards Program, Annual Project Summary (05 HQGR0045), 6 pp.
Tuttle, M. P., 2007, Re-evaluation of Earthquake Potential and Source in the Vicinity of Newburyport, Massachusetts: U.S. Geological Survey, Earthquake Hazards Program, Final Technical Report (01HQGR0163).
Tuttle, M. P., 2008, Paleoseismological investigations at the East Site, The Gilmore/Tyronza Mitigation Project, v. 4, Data Recovery at the Tyronza Sites, Poinsett County, Arkansas, The East Site (3P0610): in Technical Report to Arkansas State Highway and Transportation Department, pp. 259-277.
Tuttle, M. P., 2009, Re-evaluation of Earthquake Potential and Source in the Vicinity of Newburyport, Massachusetts: U.S. Geological Survey, Earthquake Hazards Program, Final Technical Report (03HQGR0031).
Tuttle, M. P., 2010, Search for and Study of Sand Blows at Distant Sites Resulting from Prehistoric and Historic New Madrid earthquakes: Collaborative Research, M. Tuttle & Associates and Central Region Hazards Team, U.S. Geological Survey, Final Technical Report (02HQGR0097), 48 pp.
Tuttle, M.P., Such, R., and Seeber, L., 1989, Ground failure associated with the November 25th, 1988 Saguenay earthquake in Quebec Province, Canada: in Jacob, K., ed., The 1988 Saguenay Earthquake of November 25, 1988, Quebec, Canada: Strong Motion Data, Ground Failure Observations, and Preliminary Interpretations, Buffalo, New York, National Center for Earthquake Engineering Research, pp. 1-23.
Tuttle, M., Law, T., Seeber, L., and Jacob, K., 1990, Liquefaction and ground failure in Ferland, Quebec, triggered by the 1988 Saguenay Earthquake: Canadian Geotechnical Journal, v. 27, pp. 580-589.
Tuttle, M., and Seeber, L., 1991, Historic and prehistoric earthquake-induced liquefaction in NEWBURY, Massachusetts: Geology, v. 19, pp. 594-597.
Tuttle, M. P., Cowie, P., and Wolf, L., 1992, Liquefaction induced by modern earthquakes as a key to paleoseismicity: A case study of the 1988 Saguenay earthquake: in Weiss, A., ed., Proceedings of the Nineteenth International Water Reactor Safety Information Meeting, NUREG/CP-0119, v. 3, pp. 437-462.
Tuttle, M. P., and Schweig, E. S., 1995, Archeological and pedological evidence for large earthquakes in the New Madrid seismic zone, central United States: Geology, v. 23, pp. 253256.
Tuttle, M. P., Lafferty, R. H., III, and Schweig, E. S., III, 1998, Dating of Liquefaction Features in the New Madrid Seismic Zone and Implications for Earthquake Hazard: U.S. Nuclear Regulatory Commission, NUREG/GR-0017, 77 pp.
Tuttle, M., Chester, J., Lafferty, R., Dyer-Williams, K., and Cande, B., 1999, Paleoseismology Study Northwest of the New Madrid Seismic Zone: U.S. Nuclear Regulatory Commission, NUREG/CR-5730, 98 pp.
Tuttle, M. P., Sims, J. D., Dyer-Williams, K., Lafferty, R. H., III, and Schweig, E. S., III, 2000, Dating of Liquefaction Features in the New Madrid Seismic Zone: U.S. Nuclear Regulatory Commission, NUREG/GR-0018, 42 pp.
Tuttle, M. P., and Wolf, L. W., 2003, Towards a Paleoearthquake Chronology of the New Madrid Seismic Zone: U.S. Geological Survey, Earthquake Hazards Program, Progress Report (01HQGR0164), 38 pp.
Tuttle, M. P., and Schweig, E. S., 2004, Search for and Study of Sand Blows at Distant Sites Resulting from Prehistoric and Historic New Madrid Earthquakes: U.S. Geological Survey, Earthquake Hazards Program, Annual Project Summary (02HQGR0097), 18 pp.
Tuttle, M., and Chester, J. S., 2005, Paleoseismology Study in the Cache River Valley, Southern Illinois: U.S. Geological Survey, Earthquake Hazards Program, Final Technical Report (HQ98GR00015), 14 pp.
Tuttle, M. P., Schweig, E., III, Campbell, J., Thomas, P. M., Sims, J. D., and Lafferty, R. H., III, 2005, Evidence for New Madrid earthquakes in AD 300 and 2350 B.C.: Seismological Research Letters, v. 76, no. 4, pp. 489-501.
Tuttle, M. P., Al-Shukri, H, and Mahdi, H., 2006, Very large earthquakes centered southwest of the New Madrid seismic zone 5,000-7,000 years ago: Seismological Research Letters, v. 77, no. 6, pp. 664-678.
Tuttle, M. P., and Atkinson, G. M., 2010, Localization of large earthquakes in the Charlevoix seismic zone, Quebec, Canada during the past 10,000 years: Seismological Research Letters, v. 81, no. 1, pp. 18-25.
Vaughn, J. D., 1994, Paleoseismology Studies in the Western Lowlands of Southeast Missouri: U.S. Geological Survey, Final Report (14-08-0001-G1931), 27 pp.
Weems, R. E., and Obermeier, S. F., 1990, The 1886 Charleston earthquake-An overview of geological studies: in Proceedings of the U.S. Nuclear Regulatory Commission Seventeenth Water Reactor Safety Information Meeting, NUREG/CP-0105, volume 2, pp. 289-313.
Weems, R.E., Obermeier, S.F., Pavich, M.J., Gohn, G.S., and Rubin, M., 1986, Evidence for three moderate to large prehistoric Holocene earthquakes near Charleston, South Carolina: in Proceedings of the 3rd U.S. National Conference on Earthquake Engineering, Charleston, South Carolina, v. 1, pp. 3-13.
Wesnousky, S. G., and Johnson, D. L., 1996, Stratigraphic, paleosol, and C-14 evidence for a large pre-1811 magnitude earthquake in the New Madrid seismic zone: Seismological Research Letters, v. 67, no. 2, p. 60.
Wolf, L.W., 2004, Geophysical Investigations of Earthquake-Induced Liquefaction Features in the New Madrid Seismic Zone: Earthquake Hazards Program, Final Technical Report (01HQGR0003), 36 pp.
E.5.2 References Cited in Appendix E
Aiken, M. J., 1990, Science-Based Dating in Archaeology: Longman Group, London and New York, 274 pp.
Aitken, M. J., 1998, An Introduction to Optical Dating: The Dating of Quaternary Sediments by the Use of Photon-Stimulated Luminescence: Oxford University Press, 280 pp.
Adams, J., and Basham, P., 1989, The seismicity and seismotectonics of Canada east of the Cordillera: Geoscience Canada, v. 16, pp. 3-16.
Allen, J. R. L., 1982, Sedimentary Structures: Their Character and Physical Basis, Elsevier, Amsterdam.
Ambraseys, N. N., 1988, Engineering seismology: earthquake engineering and structural dynamics: Journal of the International Association of Earthquake Engineering, v. 17, pp. 1105.
Amick, D. C., 1990, Paleoliquefaction Investigations Along the Atlantic Seaboard with Emphasis on the Prehistoric Earthquake Chronology of Coastal South Carolina: unpublished Ph.D. dissertation, University of South Carolina.
Amick, D., Gelinas, R., Maurath, G., Cannon, R., Moore, D., Billington, E., and Kemppinen, H., 1990, Paleoliquefaction Features Along the Atlantic Seaboard: U.S. Nuclear Regulatory Commission Report, NUREG/CR-5613.
Amick, D., Maurath, G., and Gelinas, R., 1990, Characteristics of seismically induced liquefaction sites and features located in the vicinity of the 1886 Charleston, South Carolina earthquake: Seismological Research Letters, v. 61, no. 2, pp. 117-130.
Amick, D. and Gelinas, R., 1991, The search for evidence of large prehistoric earthquakes along the Atlantic seaboard: Science, v. 251, pp. 655-658.
Atwater, B. F., Tuttle, M. P., Schweig, E. S., Rubin, C. M., Yamaguchi, D. K., and Hemphill-Haley, E., 2004, Earthquake recurrence inferred from paleoseismology: in Gillespie, A. R., Porter, S. C., and Atwater, B. F., eds., The Quaternary Period in the United States, Developments in Quaternary Science 1, Elsevier, Amsterdam and New York, pp. 331-350.
Audemard, F., and de Santis, F., 1991, Survey of liquefaction structures induced by recent moderate earthquakes: Bulletin of the International Association of Engineering Geology, v. 44, pp. 5-16.
Bakun, W. H., and Hopper, M., 2004, Magnitudes and locations of the 1811-1812 New Madrid, Missouri and the 1886 Charleston, South Carolina earthquakes: Bulletin of the Seismological Society of America, v. 94, pp. 64-75.
Baldwin, J. N., Witter, R. C., Vaughn, J. D., Harris, J. B., Sexton, J. L., Lake, M., Forman, S. L., and Barron, AD, 2006, Geological characterization of the Idalia Hill fault zone and its structural association with the Commerce Geophysical Lineament, Idalia, Missouri: Bulletin of the Seismological Society of America, v. 96, pp. 2281-2303.
Bent, A., 1992, A re-examination of the 1925 Charlevoix, Quebec earthquake: Bulletin of the Seismological Society of America, v. 82, pp. 2097-2113.
Birkeland, P. W., 1999, Soils and Geomorphology, 3rd Edition: Oxford University Press, New York and Oxford, 448 pp.
Bollinger, G. A., and Sibol, M. S., 1985, Seismicity, seismic reflection studies, gravity and geology of the Central Virginia seismic zone: Part I. Seismicity: Geological Society of America Bulletin, v. 96, pp. 49-57.
Bronk Ramsey, C., 1995, Radiocarbon calibration and analysis of stratigraphy: The OxCal program: Radiocarbon, v. 37, no. 2, pp. 425-430.
Bronk Ramsey, C., 2001, Development of the radiocarbon calibration program OxCal: Radiocarbon, v. 43, no. 2A, pp. 355-363.
Bronk Ramsey, C., 2009, Bayesian analysis of radiocarbon dates: Radiocarbon, v. 51, no. 1, pp. 337-360.
Brown, W., 1900, History of the Town of Hampton Falls, New Hampshire: From the Time of the First Settlement Within Its Borders, 1640 Until 1900: John F. Clark, Manchester, N.H., 637 pp.
Broughton, A. T., Van Arsdale, R. B., and Broughton, J. H., 2001, Liquefaction susceptibility mapping in the city of Memphis and Shelby County, Tennessee (in earthquake hazard evaluation in the central United States): Engineering Geology, v. 62, no. 1-3, pp. 207-222.
Castilla, R. A., and Audemard, F. A., 2007, Sand blows as a potential tool for magnitude estimation of pre-instrumental earthquakes: Journal of Seismology, v. 11, pp. 473-487.
Cetin, K. O., Seed, R. B., Kiureghian, A. D., Tokimatsu, K., Harder, Jr., L. F., Kayen, R. E., and Moss, R. E. S., 2004, Standard penetration test-based probabilistic and deterministic assessment of seismic soil liquefaction potential: Journal of Geotechnical and Geoenvironmental Engineering, ASCE, pp. 1314-1340.
Coffin, J., 1845, A Sketch of the History of NEWBURY, Newburyport, and West NEWBURY, from 1635-1845: S.G. Drake, Boston, Mass., 416 pp.
Cox, R. T., 2002, Investigation of Seismically-Induced Liquefaction in the Southern Mississippi Embayment: U.S. Geological Survey National Earthquake Hazards Reduction Program, Final Technical Report, Award #01-HQGR-0052, 15 pp.
Cox, R. T., 2009, Investigations of Seismically-Induced Liquefaction in Northeast Louisiana, U.S. Geological Survey National Earthquake Hazards Reduction Program, Final Technical Report, Award #08-HQR-0008.
Cox, R. T., and Larsen, D., 2004, Investigation of Seismically-Induced Liquefaction in the Southern Mississippi Embayment: National Earthquake Hazards Reduction Program, Final Technical Report No. 03HQGR0011, 19 pp.
Cox, R. T., Harris, J. B., Hill, A. A., Forman, S. L., Gardner, C., and Csontos, R., 2004, More evidence for young tectonism along the Saline River fault zone, southern Mississippi embayment: Eos, Transactions of the American Geophysical Union, v. 85, no. 47, Fall Meeting Supplement,Abstract T41F-1289.
Cox, R. T., Larsen, D., Forman, S. L., Woods, J., Morat, J., and Galluzzi, J., 2004, Preliminary assessment of sand blows in the southern Mississippi embayment: Bulletin of the Seismological Society of America, v. 94, pp. 1125-1142.
Cox, R. T., Larsen, D., and Hill, A. A., 2004c, More paleoliquefaction data from southeastern Arkansas: Implications for seismic hazards (abstract): GSA Joint Northeastern and Southeastern Section Meeting, Washington, D.C.
Cox, R. T., Cherryhomes, J., Harris, J. B., Larsen, D., Van Arsdale, R. B., and Forman, S. L., 2006, Paleoseismology of the southeastern Reelfoot rift in western Tennessee, U.S.A. and implications for intraplate fault zone evolution: Tectonics, v. 25, TC3019, doi:10.1029/2005TC001829, 17 pp.
Cox, R. T., Hill, A. A., Larsen, D., Holzer, T., Forman, S. L., Noce, T., Gardner, C., and Morat, J., 2007, Seismotectonic implications of sand blows in the southern Mississippi embayment: Engineering Geology, v. 89, pp. 278-299.
Cox, R. T., and Gordon, J., 2008, Sand blows on late Quaternary surfaces in northeast Louisiana: Geological Society of America Abstracts with Programs, v. 40, no. 6, p. 151.
Craven, J. A., 1995, Paleoseismological Study in the New Madrid Seismic Zone Using Geological and Archeological Features to Constrain Ages of Liquefaction Deposits: M.S. thesis, University of Memphis, 51 pp.
Dominion Nuclear North Anna, LLC (Dominion), 2004, North Anna Early Site Permit Application, Response to Request for Additional Information No. 3, Nuclear Regulatory Commission Accession Number ML042800292, July 8.
Du Berger, R., Roy, D. W., Lamontagne, M., Woussen, G., North, R. G., and Wetmiller, R. J., 1991, The Saguenay (Quebec) earthquake of November 25, 1988: Seismologic data and geologic setting: Tectonophysics, v. 186, pp. 59-74.
Dutton, C. E., 1889, The Charleston earthquake of August 31, 1886: U.S. Geological Survey 9th Annual Report 1887–1888, pp. 203-528.
Ebel, J. E., 2000, A reanalysis of the 1727 Earthquake at NEWBURY, Massachusetts: Seismological Research Letters, v. 71, pp. 364-374.
Ebel, J. E., 2001, A new look at the 1755 Cape Ann, Massachusetts earthquake: EOS, Transactions of the American Geophysical Union, v. 82, S271.
Exelon Generation Company, 2003, Clinton Early Site Permit Application, Docket No. 05200007, September 25.
Exelon Generation Company, 2004, Clinton Early Site Permit Application, Response to Request for Additional Information Letter No. 7, October 11.
Forman, S. L., Pierson, J., and Lepper, K., 2000, Luminescence geochronology: in Noller, J. S., Sowers, J. M., and Lettis, W. R., Quaternary Geochronology: Methods and Applications, AGU Reference Shelf, v. 4, pp. 157-176.
Fuller, M. L., 1912, The New Madrid Earthquake: U.S. Geological Survey Bulletin 494, 115 pp.
Gassman, S., Talwani, P., and Hasek, M., 2009, Maximum magnitudes of Charleston, South Carolina earthquakes from in-situ geotechnical data: abstracts volume from meeting of Central and Eastern U.S. Earthquake Hazards Program, University of Memphis, Memphis, Tenn., October 28-29, p. 19.
Gelinas, R., Cato, K., Amick, D., and Kemppinen, H., 1998, Paleoseismic Studies in the Southeastern United States and New England: U.S. Nuclear Regulatory Commission Report, NUREG/CR-6274.
Globensky, Y., 1987, Geologie des Basses-Terres du Saint-Laurent, Ministere des Richesses Naturelles, MM 85-02, 63 pp. and carte (1:250000) no. 1999.
Grant, L. B. and Sieh, K., 1994, Paleoseismic evidence of clustered earthquakes on the San Andreas fault in the Carrizo Plain, California: Journal of Geophysical Research, v. 99, no. B4, pp. 6819-6841.
Green, R. A., Obermeier, S. F., and Olson, S. M., 2005, Engineering geologic and geotechnical analysis of paleoseismic shaking using liquefaction effects: Field examples: Engineering Geology, v. 76, pp. 263-293.
Guccione, M. J., 2005, Late Pleistocene and Holocene paleoseismology of an intraplate seismic zone in a large alluvial valley, the New Madrid seismic zone, central USA: Tectonophysics,
v. 408, pp. 237-264.
Hajic, E. R., Wiant, M. D., and Oliver, J. J., 1995, Distribution and Dating of Prehistoric Earthquake Liquefaction in Southeastern Illinois, Central U.S.: National Earthquake Hazards Reduction Program, Final Technical Report to U.S. Geological Survey under agreement no. 1434-93-G-2359, 34 pp.
Harden, J. W., 1982, A quantitative index of soil development from field descriptions: Examples from a chronosequence in central California: Geoderma, v. 28, pp. 1-28.
Harden, J. W., and Taylor, E. M., 1983, A quantitative comparison of soil development in four climatic regions: Quaternary Research, v. 20, pp. 342-359.
Harrison, R. W., 1997, Bedrock geologic map of the St. Louis 30' x 60' quadrangle, Missouri and Illinois: U.S. Geological Survey Miscellaneous Investigations Series Map I-2533, scale 1:100,000.
Holbrook, J., Autin, W. J., Rittenour, T. M., Marshak, S., and Goble, R. J., 2006, Stratigraphic evidence for millennial-scale temporal clustering of earthquakes on a continental-interior fault: Holocene Mississippi River floodplain deposits, New Madrid seismic zone, USA: Tectonophysics, v. 420, pp. 431-454.
Hough, S. E., Armbruster, J. G., Seeber, L., and Hough, J. F., 2000, On the modified Mercalli intensities and magnitudes of the 1811-1812 New Madrid: Journal of Geophysical Research, v. 105, pp. 23,839-23,864.
Hough, S. E., and Martin, S., 2002, Magnitude estimates of two large aftershocks of the 16 December 1811 New Madrid earthquake: Bulletin of the Seismological Society of America, v. 92, no. 8, pp. 3259-3268.
Hough, S. E., and Page, M., 2011, Toward a consistent model for strain accrual and release for the New Madrid seismic zone, Central U.S.: Journal of Geophysical Research, v. 116, B03311, doi:10.1029/2010JB007783.
Hu, K., Gassman, S. L., and Talwani, P., 2002a, In-situ properties of soils at paleoliquefaction sites in the South Carolina coastal plain: Seismological Research Letters, v. 73, no. 6, pp. 964-978.
Hu, K., Gassman, S. L., and Talwani, P., 2002b, Magnitudes of prehistoric earthquakes in the South Carolina coastal plain from geotechnical data: Seismological Research Letters, v. 73, no. 6, pp. 979-991.
Jenny, H., 1941, Factors of Soil Formation: McGraw-Hill, New York, 281 pp.
Jenny, H., 1961, Derivation of state factor equations of soils and ecosystems, Soil Science Society of America, Proceedings, v. 25, pp. 385-388.
Johnston, A. C., 1996c, Seismic moment assessment of stable continental earthquakes, Part III: 1811-1812 New Madrid, 1886 Charleston and 1755 Lisbon: Geophysical Journal International, v. 126, pp. 314-344.
Johnston, A. C., and Kanter, L. R., 1990, Earthquakes in stable continental crust: Scientific American, v. 262, pp. 68-75.
Johnston, A. C., and Schweig, E. S., 1996, The enigma of the New Madrid earthquakes of 18111812: Annual Review of Earth and Planetary Sciences, v. 24, pp. 339-384.
Kelson, K. I., Simpson, G. D., Van Arsdale, R. B., Harris, J. B., Haradan, C. C., and Lettis, W. R., 1996, Multiple Holocene earthquakes along the Reelfoot fault, central New Madrid seismic zone: Journal of Geophysical Research, v. 101, pp. 6151-6170.
Kuenen, P. H., 1958, Experiments in geology: Transactions of the Geological Society of Glasgow, v. 23, pp. 1-28.
Kumarapeli, P. S., and Saull, V., 1966, The St. Lawrence valley system: North American equivalent of the East African rift valley system: Canadian Journal of Earth Sciences, v. 3, pp. 639-658.
Kuribayashi, E., and Tatsuoka, F., 1975, Brief review of liquefaction during earthquakes in Japan: Soils and Foundations, v. 15, pp. 81-92.
Lamontagne, M., 2009, Description and analysis of the earthquake damage in the Quebec city region between 1608 and 2008: Seismological Research Letters, v. 80, no. 3, pp. 514-424.
Lamontagne, M., Halchuk, S., Cassidy, J. F., and Rogers, G. C., 2007, Significant Canadian Earthquakes, 1600-2006: Geological Survey of Canada Open File 5539, 32 pp.
Lamontagne, M., Keating, P., and Toutin, T., 2000, Complex faulting confounds earthquake research in the Charlevoix seismic zone, Québec: Eos, Transactions of the American Geophysical Union, v. 81, pp. 26, 289, 292, 293.
LDRL (Luminescence Dating Research Laboratory, University of Illinois at Chicago), 2010, Luminescence Tutorial-Optically Stimulated Luminescence (OSL), website accessed June 10, 2010, http://www.uic.edu/labs/ldrl/osl.html.
Leon, E., 2003, Effect of Aging of Sediments on Paleoliquefaction Evaluation in the South Carolina Coastal Plain: unpublished Ph.D. dissertation, University of South Carolina, 181 pp.
Leon, E., Gassman, S. L., and Talwani, P., 2005, Effect of soil aging on assessing magnitudes and accelerations of prehistoric earthquakes: Earthquake Spectra, v. 21, no. 3, pp. 737-759.
Lepper, K., 2007, Optically stimulated luminescence dating-An introduction: New Mexico Geology, v. 29, no. 4, p. 111.
Levesque, C., Locat, J., and Leroueil, S., 2006, Dating submarine mass movements triggered by earthquakes in the Upper Saguenay Fjord, Quebec, Canada: Norwegian Journal of Geology, v. 86, pp. 231-242.
Liao, T., Mayne, P. W., Tuttle, M. P., Schweig, E. S., Van Arsdale, R. B., 2002, CPT site characterization for seismic hazards in the New Madrid seismic zone: Soil Dynamics and Earthquake Engineering, v. 22, pp. 943-950.
Locat, J., 2008, Localization et magnitude du séisme du 5 Février 1663 (Quebec) revues a l’aide des mouvements de terrain: in Locat, J., Perret, D., Turmel, D., Demers, D., and Leroueil, S., eds., Proceedings of the 4th Canadian Conference on Geohazards: From Causes to Management, University of Laval Press, Quebec, 594 pp.
Lowe, D. R., 1975, Water escape structures in coarse-grained sediment: Sedimentology, v. 22, pp. 157-204.
Lowe, D. R., and LoPiccolo, R. D., 1974, The characteristics and origins of dish and pillar structures: Journal of Sedimentary Petrology, v. 44, pp. 484-501.
Magnani, B., and McIntosh, K., 2009, Towards an Understanding of the Long-Term Deformation of the Mississippi Embayment: U.S. Geological Survey, Final Technical Report (08HQGR0089), 19 pp.
Mahan, S., Counts, R., Tuttle, M., and Obermeier, S., 2009, Can OSL be used to date paleoliquefaction events? Abstracts volume from meeting of Central and Eastern U.S. Earthquake Hazards Program, University of Memphis, Memphis, Tenn., October 28-29, pp. 24-25.
Mahan, S. A., and Crone, A. J., 2006, Luminescence dating of paleoliquefaction features in the Wabash River Valley of Indiana: in Wide, R. A., ed., Proceedings of the 4th New World Luminescence Dating and Dosimetry Workshop, Denver, Colorado: U.S. Geological Survey Open-File Report 2006-1351, 22 pp.
McBride, J. H., Nelson, W. J., and Stephenson, W. J., 2002, Integrated geological and geophysical study of Neogene and Quaternary-age deformation in the northern Mississippi embayment: Seismological Research Letters, v. 73, pp. 597-627.
McCartan, L., Lemon, E. M., Jr., and Weems, R. E., 1984, Geologic Map of the Area Between Charleston and Orangeburg, South Carolina: U.S. Geological Series Miscellaneous Investigations Series Map I-1472, 1: 250,000-scale.
McKeever, S. W. S., 2001, Optically stimulated luminescence dosimetry: Nuclear Instruments and Methods in Physics Research B-Beam Interactions with Materials & Atoms, v. 184, no. 1-2, pp. 29-54.
McNulty, W. E., and Obermeier, S. F., 1997, Liquefaction Evidence for Two Holocene Paleoearthquakes in Central and Southwestern Illinois: U.S. Geological Survey Open-File Report 97-435, 14 pp.
McNulty, W. E., and Obermeier, S. F., 1999, Liquefaction evidence for at least two strong Holocene paleo-earthquakes in central and southwestern Illinois, USA: Environmental and Engineering Geoscience, v. 5, no. 2, pp. 133-146.
Mitchell, B. J., Nuttli, O. W., Herrmann, R. B., and Stauder, W., 1991, Seismotectonics of the central United States: in Slemmons, D.B., Engdahl, E.R., Zoback, M.D., and Blackwell, D.D., eds., Neotectonics of North America: Decade Map Volume 1, Geological Society of America, pp. 245-260.
Munson, P. J., and Munson, C. A., 1996, Paleoliquefaction Evidence for Recurrent Strong Earthquakes Since 20,000 Years BP in the Wabash Valley Area of Indiana: report submitted to the U.S. Geological Survey in fulfillment of National Earthquake Hazards Reduction Program Grant No. 14-08-0001-G2117, 137 pp.
Munson, P. J., Munson, C. A., and Pond, E. C., 1995, Paleoliquefaction evidence for a strong Holocene earthquake in south-central Indiana: Geology, v. 23, pp. 325-328.
Munson, P. J., Obermeier, S. F., Munson, C. A., and Hajic, E. R., 1997, Liquefaction evidence for Holocene and latest Pleistocene seismicity in the southern halves of Indiana and Illinois: A preliminary overview: Seismological Research Letters, v. 68, pp. 521-536.
Murray, A. S., and Olley, J. M., 2002, Precision and accuracy in the optically stimulated luminescence dating of sedimentary quartz-An overview: Geochronometria, v. 21, pp. 1-16.
Noller, J. S., and Forman, S. L., 1998, Luminescence geochronology of liquefaction features near Georgetown, South Carolina: in Sowers, J. M.,
Noller, J. S., and Lettis, W. R., eds., Dating and Earthquakes: Review of Quaternary Geochronology and Its Application to Paleoseismology, U.S. Nuclear Regulatory Commission Report, NUREG/CR-5562, pp. 4.49-4.57.
Nuttli, O., and Brill, K., 1981, Earthquake source zones in the central United States determined from historical seismicity: in Barstow, N.L., Brill, K.G., Nuttli, O.W., and Pomeroy, P.W., eds., Approach to Seismic Zonation for Siting Nuclear Electric Power Generating Facilities in the Eastern United States, U.S. Nuclear Regulatory Commission Report NUREG/CR1577, pp. 98-143.
Obermeier, S. F., 1989, The New Madrid Earthquakes: An Engineering-Geologic Interpretation of Relict Liquefaction Features: U.S. Geological Survey Professional Paper 1336-B, p. 114.
Obermeier, S. F., 1996, Using liquefaction-induced features for paleoseismic analysis: in McCalpin, J. P., ed., Paleoseismology, Academic Press, San Diego, CA, pp. 331-396.
Obermeier, S. F., 1998, Liquefaction evidence for strong earthquakes of Holocene and latest Pleistocene ages in the states of Indiana and Illinois, USA: Engineering Geology, v. 50, pp. 227-254.
Obermeier, S. F., 2009, Using liquefaction-induced and other soft-sediment features for paleoseismic analysis: International Geophysics, v. 95, pp. 499-566.
Obermeier, S. F., Weems, R. E., Jacobson, R. B., and Gohn, G. S., 1989, Liquefaction evidence for repeated Holocene earthquakes in the coastal region of South Carolina: Annals of the New York Academy of Sciences, v. 558, pp. 183-195.
Obermeier, S. F., Jacobson, R. B., Smoot, J. P., Weems, R. E., Gohn, G. S., Monroe, J. E., and Powars, D. S., 1990, Earthquake-Induced Liquefaction Features in the Coastal Setting of South Carolina and in the Fluvial Setting of the New Madrid Seismic Zone: U.S. Geological Survey Professional Paper 1504, pp. 44.
Obermeier, S. F., Bleuer, N. R., Munson, C. A., Munson, P. J., Martin, W. S., McWilliams, K. M., Tabaczynski, D. A., Odum, J. K., Rubin, M., and Eggert, D. L., 1991, Evidence of strong earthquake shaking in the lower Wabash Valley from prehistoric liquefaction features: Science, v. 251, pp. 1061-1062.
Obermeier, S. F., Martin, J. R., Frankel, A. D., Youd, T. L., Munson, P. J., Munson, C. A., and Pond, E. C., 1993, Liquefaction Evidence for One or More Strong Holocene Earthquakes in the Wabash Valley of Southern Indiana and Illinois, with a Preliminary Estimate of Magnitude: U.S. Geological Survey Professional Paper 1536, 27 pp.
Obermeier, S. F., and McNulty, W. E., 1998, Paleoliquefaction evidence for seismic quiescence in central Virginia during late and middle Holocene time: Eos, Transactions of the American Geophysical Union, v. 79, no. 17, Spring Meeting Supplement, Abstract T41A-9.
Obermeier, S. F., Pond, E. C., Olson, S. M., Green, R. A., Stark, T. D., and Mitchell, J. K., 2001, Paleoseismic Studies in Continental Settings-Geologic and Geotechnical Factors in Interpretations and Back-Analysis: U.S. Geological Survey Open-File Report 01-29, 53 pp.
O’Brien, M. J., and Lyman, R. L., 1999, Seriation, Stratigraphy, and Index Fossils: The Backbone of Archaeological Dating: Plenum Press, New York, 261 pp.
Olson, S. M., Green, R. A., and Obermeier, S. F., 2005b, Revised magnitude bound relation for the Wabash Valley seismic zone of the central United States: Seismological Research Letters, v. 76, no. 6, pp. 756-771.
Olson, S. M., Obermeier, S. F., and Stark, T. D., 2001, Interpretation of penetration resistance for back-analysis at sites of previous liquefaction: Seismological Research Letters, v. 72, no. 1, pp. 46-59.
Owen, H. G., 1987, Deformation processes in unconsolidated sands: Geological Society of London Special Publications 1987, v. 29, pp. 11-24.
Pierce, K., 1986, Dating methods: in Geophysics Study Committee, Geophysics Research Forum, National Research Council, authors, Active Tectonics: Impact on Society, The National Academies Press, Washington, D.C., pp. 195-214.
Pond, E.C., 1996, Seismic Parameters from the Central United States Based on Paleoliquefaction Evidence in the Wabash Valley: Ph.D. Dissertation, Virginia Polytechnic Institute, Blacksburg, Virginia, 583 pp.
Pond, E. C., and Martin, J. R., 1997, Estimated magnitudes and accelerations associated with prehistoric earthquakes in the Wabash Valley region of the central United States: in Kolata, D. R., and Hildenbrand, T. G. (editors), Investigations of the Illinois Basin Earthquake Region: Seismological Research Letters, v. 68, pp. 611-623.
Al-Qadhi, O., 2010, Geophysical Investigation of Paleoseismological Features in Eastern Arkansas, USA: Ph.D. Dissertation, University of Arkansas at Little Rock, p. 277.
Reimer, P. J., Baillie, M. G. L., Bard, E., Bayliss, A., Beck, J. W., Blackwell, P. G., Bronk Ramsey, C., Buck, C. E., Burr, G., Edwards, R. L., Friedrich, M., Grootes, P. M., Guilderson, T. P., Hajdas, I., Heaton, T. J., Hogg, A. G., Hughen, K. A., Kaiser, K. F., Kromer, B., McCormac, F. G., Manning, S. W., Reimer, R. W., Richards, D. A., Southon, J., Turney, C. S. M., van der Plicht, J., and Weyhenmeyer, C., 2009, IntCal09 and Marine09 radiocarbon age calibration curves, 0–50,000 years cal BP: Radiocarbon, v. 51, no. 4, pp. 1111–1150.
Rondot, J., 1979, Reconnaissances Géologiques dans Charlevoix-Saguenay: Ministère des Richesses Naturelles du Québec, Rapport DPV-682, 44 pp.
Russ, D. P., 1982, Style and significance of surface deformation in the vicinity of New Madrid, Missouri: in McKeown, F. A. and Pakiser, L. C., eds., Investigations of the New Madrid, Missouri, Earthquake Region, U.S. Geological Survey Professional Paper 1236, pp. 94-114.
Saucier, R. T., 1977, Effects of the New Madrid Earthquake Series in the Mississippi Alluvial Valley: U.S. Army Corps of Engineers Waterways Experiment Station Misc. Paper S-77-5.
Saucier, R. T., 1989, Evidence for episodic sand-blow activity during the 1811-12 New Madrid (Missouri) earthquake series: Geology, v. 17, p. 103-106.
Saucier, R T., 1991, Geoarchaeological evidence of strong prehistoric earthquakes in the New Madrid (Missouri) seismic zone: Geology, v. 19, p. 296-298.
Saucier, R. T., 1994, Geomorphology and Quaternary Geologic History of the Lower Mississippi: U.S. Army Corps of Engineers Waterways Experiment Station, vols. 1 and 2, 364 pp., 28 plates.
Schneider, J.A., and Mayne, P.W., 2000, Liquefaction Response of Soils in Mid-America Evaluated by Seismic Cones Test: Mid-America Earthquake Center Report MAE-GT-3A, 292 pp.
Schneider, J.A., Mayne, P.W., and Rix, G.J., 2001, Geotechnical site characterization in the greater Memphis area using CPT: Engineering Geology, v. 62, no. 1-3, pp. 169-184.
Seed, H. B., and Idriss, I. M., 1982, Ground Motions and Soil Liquefaction During Earthquakes, Earthquake Engineering Research Institute, Berkeley, Calif., 134 pp.
Al-Shukri, H., Lemmer, R. E., Mahdi, H. H., and Connelly, J. B., 2005, Spatial and temporal characteristics of paleoseismic features in the southern terminus of the New Madrid seismic zone in eastern Arkansas: Seismological Research Letters, v. 76, no. 4, pp. 502-511.
Al-Shukri, H., Mahdi, H., Al Kadi, O., and Tuttle, M. P., 2009, Spatial and Temporal Characteristics of Paleoseismic Features in the Southern Terminus of the New Madrid Seismic Zone in Eastern Arkansas: Final Technical Report to U.S. Geological Survey, 24 pp.
Al-Shukri, H., Mahdi, H., and Tuttle, M., 2006, Three-dimensional imaging of earthquake-induced liquefaction features with ground penetrating radar near Marianna, Arkansas: Seismological Research Letters, v. 77, pp. 505-513.
Sims, J. D., 1973, Earthquake-induced structures in sediments of Van Norman Lake, San Fernando California: Science, v. 182, pp. 161-163.
Sims, J. D., 1975, Determining earthquake recurrence intervals from deformational structures in young lacustrine sediments: Tectonophysics, v. 29, pp. 141-153.
Sims, J. D., and Garvin, C. D., 1995, Recurrent liquefaction at Soda Lake, California, induced by the 1989 Loma Prieta earthquake, and 1990 and 1991 aftershocks: Implications for paleoseismicity studies: Bulletin of the Seismological Society of America, v. 85, pp. 51-65.
Smith, W. E. T., 1966, Earthquakes of eastern Canada and adjacent areas 1928-1959, Publication of the Dominion Observatory v. 32, pp. 87-121.
Somerville, P. G., McLaren, J. P., Saikia, C. K., and Helmberger, D. V., 1990, The 25 November 1988 Saguenay, Quebec, earthquake source parameters and the attenuation of strong ground motion: Bulletin of the Seismological Society of America, v. 80, pp. 1118-1143.
Stahle, D. W., Cook, E. R., and White, J. W. C., 1985, Tree-ring dating of baldcypress and the potential for millennia-long chronologies in the Southeast: American Antiquity, v. 50, pp. 796-802.
Stahle, D. W., Fye, F. K., and Therrell, M. D., 2004, Interannual to decadal climate and streamflow variability estimates from tree rings: in Gillespie, A. R., Porter, S. C., and Atwater, B. F., eds., The Quaternary Period in the United States: Developments in Quaternary Science 1, Elsevier, Amsterdam and New York, pp. 491-504.
Stark, T. D., 2002, Interpretation of Ground Shaking from Paleoliquefaction Features: U.S. Geological Survey, Annual Technical Report.
Stuiver, M., Long A., Kra, R. S., and Devine, J. M., 1993, Calibration-1993: Radiocarbon, v. 35, no. 1, pp. 35-65.
Stuiver, M., and Pearson, G. W., 1993, High-precision bidecadal calibration of the radiocarbon time scale, AD 1950-500 BC and 2500-6000 BC: Radiocarbon, v. 35, no. 1, pp. 1-25.
Stuiver, M., and Reimer, P. J., 1993, Extended 14C data base and revised CALIB 3.0 14C age calibration program: Radiocarbon, v. 35, pp. 215-230.
Stuiver, M., Reimer, P. J., and Braziunas, T. F., 1998, High-precision radiocarbon age calibration for terrestrial and marine samples: Radiocarbon, v. 40, no. 3, pp. 1127-1151.
Stuiver, M., Reimer, P. J., and Reimer, R. W., 2005, CALIB 6.0, [WWW program and documentation -http://intcal.qub.ac.uk/calib/].
Talma, A. S., and Vogel, J. C., 1993, A simplified approach to calibrating C14 dates: Radiocarbon, v. 35, pp. 317-322.
Talwani, P. and Cox, J., 1985, Paleoseismic evidence for recurrence of earthquakes near Charleston, South Carolina: Science, v. 228, pp. 379-381.
Talwani, P., Dura-Gomez, I., Gassman, S., Hasek, M., and Chapman, A., 2008, Studies related to the discovery of a prehistoric sandblow in the epicentral area of the 1886 Charleston SC earthquake: Trenching and geotechnical investigations: Program and Abstracts, Eastern Section of the Seismological Society of America, p. 50.
Talwani, P., and Schaeffer, W. T., 2001, Recurrence rates of large earthquakes in the South Carolina Coastal Plain based on paleoliquefaction data: Journal of Geophysical Research, v. 106, no. B4, pp. 6621-6642.
Trumbore, S. E., 1989, AMS 14C measurements of fractionated soil organic matter: an approach to deciphering the soil carbon cycle: Radiocarbon, v. 31, no. 3, pp. 644-654.
Tuttle, M. P., 1994, The Liquefaction Method For Assessing Paleoseismicity: U.S. Nuclear Regulatory Commission, NUREG/CR-6258, 38 pp.
Tuttle, M. P., 1999, Late Holocene Earthquakes and Their Implications for Earthquake Potential of the New Madrid Seismic Zone, Central United States: Ph.D. dissertation, University of Maryland, 250 pp.
Tuttle, M. P., 2000, Paleoseismological Study in the St. Louis Region: U.S. Geological Survey, Earthquake Hazards Program, Final Technical Report (99HQGR0032), 29 pp.
Tuttle, M. P., 2001, The use of liquefaction features in paleoseismology: Lessons learned in the New Madrid seismic zone, central United States: Journal of Seismology, v. 5, pp. 361-380.
Tuttle, M. P., 2005a, Improving the Earthquake Chronology for the St. Louis Region: U.S. Geological Survey, Earthquake Hazards Program, Annual Project Summary (05HQGR0045), 6 pp.
Tuttle, M. P., 2007, Re-evaluation of Earthquake Potential and Source in the Vicinity of Newburyport, Massachusetts: U.S. Geological Survey, Earthquake Hazards Program, Final Technical Report (01HQGR0163).
Tuttle, M. P., 2009, Re-evaluation of Earthquake Potential and Source in the Vicinity of Newburyport, Massachusetts: U.S. Geological Survey, Earthquake Hazards Program, Final Technical Report (03HQGR0031).
Tuttle, M. P., 2010, Search for and Study of Sand Blows at Distant Sites Resulting from Prehistoric and Historic New Madrid Earthquakes: Collaborative Research, M. Tuttle & Associates and Central Region Hazards Team, U.S. Geological Survey, Final Technical Report (02HQGR0097), 48 pp.
Tuttle, M. P., Seeber, L., and Bradley, L., 1987, Liquefaction of glaciomarine sediments during the 1727 earthquake in Newburyport, Massachusetts: in Jacob, K. H., ed., Proceedings from the Symposium on Seismic Hazards, Ground Motions, Soil-Liquefaction and Engineering Practice inEastern North America, NCEER Technical Report NCEER-87-0025, pp. 467-479.
Tuttle, M. P., Such, R., and Seeber, L., 1989, Ground failure associated with the November 25th, 1988 Saguenay earthquake in Quebec Province, Canada: in Jacob, K., ed., The 1988 Saguenay Earthquake of November 25, 1988, Quebec, Canada: Strong Motion Data, Ground Failure Observations, and Preliminary Interpretations, National Center for Earthquake Engineering Research, Buffalo, New York, pp. 1-23.
Tuttle, M., Law, T., Seeber, L., and Jacob, K., 1990, Liquefaction and ground failure in Ferland, Quebec, triggered by the 1988 Saguenay earthquake: Canadian Geotechnical Journal, v. 27, pp. 580-589.
Tuttle, M., and Seeber, L., 1991, Historic and prehistoric earthquake-induced liquefaction in NEWBURY, Massachusetts: Geology, v. 19, pp. 594-597.
Tuttle, M. P., Cowie, P., and Wolf, L., 1992, Liquefaction induced by modern earthquakes as a key to paleoseismicity: A case study of the 1988 Saguenay earthquake: in Weiss, A., ed., Proceedings of the Nineteenth International Water Reactor Safety Information Meeting, NUREG/CP-0119, v. 3, pp. 437-462.
Tuttle, M. P., and Schweig, E. S., 1995, Archeological and pedological evidence for large earthquakes in the New Madrid seismic zone, central United States: Geology, v. 23, no. 3, pp. 253-256.
Tuttle, M., and Barstow, N., 1996, Liquefaction-related ground failure: A case study in the New Madrid seismic zone, Central United States: Bulletin of the Seismological Society of America,
v. 86, pp. 636–645.
Tuttle, M. P., Lafferty, R. H., Chester, J. S., and Haynes, M., 1996, Evidence of earthquake-induced liquefaction north of the New Madrid seismic zone, central United States: Seismological Research Letters, v. 67, no. 2, p. 58.
Tuttle, M. P., Lafferty, R. H., Guccione, M. J., Schweig, E. S., Lopinot, N., Cande, R. F., Dyer-Williams, K., and Haynes, M., 1996, Use of archaeology to date liquefaction features and seismic events in the New Madrid seismic zone, central United States: Geoarchaeology: An International Journal, v. 11, no. 6, pp. 451-480.
Tuttle, M. P., Lafferty, R. H., III, and Schweig, E. S., III, 1998, Dating of Liquefaction Features in the New Madrid Seismic Zone and Implications for Earthquake Hazard: U.S. Nuclear Regulatory Commission, NUREG/GR-0017, 77 pp.
Tuttle, M., Chester, J., Lafferty, R., Dyer-Williams, K., and Cande, B., 1999, Paleoseismology Study Northwest of the New Madrid Seismic Zone: U.S. Nuclear Regulatory Commission, NUREG/CR-5730, 98 pp.
Tuttle, M. P., Collier, J., Wolf, L. W., and Lafferty, R. H., 1999, New evidence for a large earthquake in the New Madrid seismic zone between AD 1400 and 1670: Geology, v. 27, no. 9, pp. 771-774.
Tuttle, M. P., Sims, J. D., Dyer-Williams, K., Lafferty, R. H., III, and Schweig, E. S., III, 2000, Dating of Liquefaction Features in the New Madrid Seismic Zone: U.S. Nuclear Regulatory Commission, NUREG/GR-0018, 42 pp.
Tuttle, M. P., Schweig, E. S., Sims, J. D., Lafferty, R. H., Wolf, L. W., Haynes, M. L., 2002, The earthquake potential of the New Madrid seismic zone: Bulletin of the Seismological Society of America, v. 92, no. 6, pp. 2080-2089.
Tuttle, M. P., Hengesh, J., Tucker, K. B., Lettis, W., Deaton, S. L., and Frost, J. D., 2002, Observations and comparisons of liquefaction features and related effects induced by the Bhuj earthquake: Earthquake Spectra, v. 18, Supplement A, pp. 79-100.
Tuttle, M. P., and Schweig, E., 2004, Search for and Study of Sand Blows at Distant Sites Resulting from Prehistoric and Historic New Madrid Earthquakes: U.S. Geological Survey, Annual Technical Report.
Tuttle, M. P., Schweig, E. S., and Dyer-Williams, K., 2004, Paleoseismology Study in the St. Louis Region: USGS Final Technical Report.
Tuttle, M. P., Schweig, E., III, Campbell, J., Thomas, P. M., Sims, J. D., and Lafferty, R. H., III, 2005, Evidence for New Madrid earthquakes in AD 300 and 2350 B.C: Seismological Research Letters, v. 76, no. 4, pp. 489-501.
Tuttle, M. P., Al-Shukri, H, and Mahdi, H., 2006, Very large earthquakes centered southwest of the New Madrid seismic zone 5,000-7,000 years ago: Seismological Research Letters, v. 77, no. 6, pp. 664-678.
Tuttle, M. P, and Atkinson, G. M., 2010, Localization of large earthquakes in the Charlevoix zone, Quebec, Canada, during the past 10,000 years: Seismological Research Letters, v. 81, no. 1, pp. 140-147.
Vaughn, J. D., 1994, Paleoseismology Studies in the Western Lowlands of Southeast Missouri: U.S. Geological Survey, Final Report (14-08-0001-G1931), 27 pp.
Vogel, J. C., Fuls, A., Visser, E., and Becker, B., 1993, Pretoria calibration curve for short lived samples: Radiocarbon, v. 33, pp. 73-86.
Walker, M., 2005, Quaternary Dating Methods: John Wiley and Sons, Ltd, West Sussex, England, 286 pp.
Weems, R. E. and Obermeier, S. F., 1990, The 1886 Charleston Earthquake-An Overview of Geological Studies: in Proceedings of the U.S. Nuclear Regulatory Commission Seventeenth Water Reactor Safety Information Meeting, NUREG/CP-0105, volume 2, pp. 289-313.
Wheeler, R.L., 2002, Distinguishing seismic from non-seismic soft-sediment structures: Criteria from seismic hazard analysis: in Ettensohn, F.R., Rast, N., and Brett, C.E., eds., Ancient Seismites, Geological Society of America Special Paper 359, Boulder, Colorado, pp. 1-11.
Wheeler, R. L., and Johnston, A. C., 1992, Geologic implications of earthquake source parameters in central and eastern North America: Seismological Research Letters, v. 63, no. 4, pp. 491-505.
Wintle, A. G., and Murray, A. S., 1997, The relationship between quartz thermo luminescence, photo-transferred luminescence, and optically stimulated luminescence: Radiation Measurements, v. 27, no. 4, pp. 611-624.
Wolf, L. W., Collier, J., Tuttle, M., and Bodin, P., 1998, Geophysical reconnaissance of earthquake-induced liquefaction features in the New Madrid seismic zone: Journal of Applied Geophysics, v. 39, pp. 121-129.
Wolf, L. W., Tuttle, M. P., Browning, S., and Park, S., 2006, Geophysical surveys of earthquake-induced liquefaction deposits in the New Madrid seismic zone: Geophysics, v. 71, no. 6, pp. B223-230.
Youd, T. L., 1984, Geologic Effects-Liquefaction and Associated Ground Failure: U.S. Geological Survey Open-File Report 84-760, pp. 210-232.
Youd, T. L., Idriss, I. M., Andrus, R. D., Arango, I., Castro, G., Christian, J. T., Dobry, R., Finn, W. D. L., Harder, Jr., L. F., Hynes, M. E., Ishihara, K., Koester, J. P., Liao, S. S. C., Marcuson, III, W. F., Martin, G. R., Mitchell, J. K., Yoshiharu, M., Power, M. S., Robertson, P. K., Seed, R. B., and Stokoe, II, K. H., 2001, Liquefaction resistance of soils: Summary report from the 1996 NCEER and 1998 NCEER/NSF workshops on evaluation of liquefaction resistance of soils: Journal of Geotechnical and Geoenvironmental Engineering, ASCE, v. 127, pp. 817-833.