8.1 Background on Demonstration Hazard Calculations
Demonstration hazard calculations were made at seven test sites to illustrate the effects that the seismic sources have on calculated seismic hazard, and to compare with hazards from previous CEUS seismic source models. All of these calculations were made for demonstration purposes only and should not be used for design or analysis decisions for any engineered facility.
Seven test sites were selected for demonstration calculations. These are listed in Table 8.1-1, along with the reason for choosing each site. A map of the seven sites is shown on Figure 8.1-1.
Seismic hazard was calculated for hard rock conditions using the ground motion equations from EPRI (2004, 2006). For these equations, hard rock is defined as rock with a shear wave velocity (VS) of 2,800 m/s (9,200 ft/s). Most of the seismic hazard results presented in this section are for hard rock conditions (labeled "rock" in Section 8.2).
For calculating hazard on hard rock, the EPRI (2004) ground-motion equations were used with the EPRI (2006) aleatory standard deviations. These equations use distance to the surface projection of the rupture ("Joyner Boore distance") and closest distance to the rupture, when the earthquake rupture is defined. When (for seismic hazard calculations) the rupture geometry is unknown and the earthquake is represented as a point, the EPRI (2004) report includes correction terms for the distance measures and for the aleatory standard deviation, to modify these parameters for point-source conditions. These modifications were implemented within the seismic hazard calculations.
For cases where the causative fault geometry is known (or at least modeled), the distance measures from a site to the rupture are calculated explicitly. The three central faults of the New Madrid fault system are an example. For cases where fault locations are unknown but fault orientation is known (or at least modeled), the hazard calculation assumes a uniform spatial distribution of rupture within the defined geometry of the source, each rupture with the correct orientation. Relationships between earthquake magnitude and rupture length are given in the HID for each applicable source.
Seismic hazard results are also presented in this section for two soil conditions: shallow, stiff soil and deep, soft soil. These give a range of hazard results that might be expected at the seven test sites. For example, a deep soil site might be expected to affect long period ground motions from a large, distant earthquake, and the generic deep-soil model adopted here will represent that effect.
Two hypothetical soil profiles were used; VS versus depth plots for these two profiles are shown on Figures 8.1-2 (for the shallow soil site) and 8.1-3 (for the deep soil site). Generic mean amplification factors for the two soil profiles are shown on Figures 8.1-4 and 8.1-5 for 10 Hz spectral acceleration (SA), 1 Hz SA, and peak ground acceleration (PGA). As expected, the shallow soil profile amplifies high frequencies, and the deep soil profile amplifies low frequencies. Uncertainties in amplification factor were included, with logarithmic standard deviations dependent on spectral frequency and amplitude. These standard deviations include the effect of uncertainties in VS versus depth and in soil parameters, and range from 0.07 to 0.25.
Demonstration results are included in Section 8.2 for hard rock, shallow soil, and deep soil site conditions at the seven test sites. These hazard results are plotted for annual frequencies of exceedance from 10-3 to 10-6. Note that seismic hazard calculations for critical facilities may require calculations over a different range-in particular, down to annual frequencies of exceedance of 10-7.
8.2 Demonstration Hazard Calculations
This section presents demonstration hazard calculations for the seven test sites. Figures with hazard results in Sections 8.2.1 through 8.2.7 are presented first for hard rock site conditions (labeled "rock" below) in the order outlined below for each site. The results are then presented for rock, shallow soil, and deep soil. Finally, sensitivity plots are presented showing how sensitive the hazard is to some of the input assumptions.
Rock Hazard
Figures a–c: Mean rock hazard and 0.85, 0.5, and 0.15 fractile hazard curves for 10 Hz SA, 1 Hz SA, and PGA. Digital values for the rock hazard curves are provided in Tables 8.2.1-1 to 8.2.7-1; corresponding figures are indicated in the table titles.
Figures d–f: Total mean rock hazard and contribution by background and RLME source for 10 Hz SA, 1 Hz SA, and PGA.
Figures g–i: Contribution to mean rock hazard by individual background source for 10 Hz SA, 1 Hz SA, and PGA.
Hazard Comparisons
Figures j–l: Comparison of mean rock hazard from three source models for 10 Hz SA, 1 Hz SA, and PGA. This comparison shows total hazard for the current CEUS-SSC source model and for two other source models, all using the EPRI (2004, 2006) ground-motion model. One source model is the USGS model developed for the National Seismic Hazard Mapping Project (Petersen et al., 2008). The other is the "COLA" model that has been used for nuclear power plant licensing applications since 2003. This is the EPRI-SOG (EPRI, 1988) model updated with more recent characterizations of several seismic sources. The updated New Madrid fault source (NMFS) is based on the Clinton and Bellefonte applications, and the updated Charleston seismic zone is based on the Vogtle application. Also, maximum magnitude (Mmax) values for some seismic sources near the Gulf of Mexico coastline were updated to reflect recent seismicity. Calculations of hazard for all three models use the EPRI (2004, 2006) ground-motion equations, so the differences in hazard presented here between the three models is attributable to differences in the source models themselves.
Shallow Soil Hazard
Figures m–o: Total mean shallow-soil hazard and contribution by background and RLME source for 10 Hz SA, 1 Hz SA, and PGA.
Deep Soil Hazard
Figures p–r: Total mean deep-soil hazard and contribution by background and RLME source for 10 Hz SA, 1 Hz SA, and PGA.
All Site Conditions
Figures s–u:Total mean hazard for rock, shallow soil, and deep soil conditions for 10 Hz SA, 1 Hz SA, and PGA.
Hazard Sensitivity
Figures v and w: Mean rock hazard for Mmax background sources and for seismotectonic background sources for 10 Hz SA and 1 Hz SA. Note that the hazard from RLME sources is not included in these plots, and that each set of background sources is given a weight of unity for these plots only. The legends in these plots indicate the weights assigned in the logic tree for total hazard calculations.
Figures x and y: Mean rock hazard sensitivity to Mmax for the dominant background source for 10 Hz SA and 1 Hz SA. These hazard curves include the weight assigned to the dominant background source, but assign a weight of unity to the individual Mmax values (for these plots only). The legends in these plots indicate the total weight assigned in hazard calculations to each Mmax value, including the probability of activity.
Figures z and aa: Mean rock hazard sensitivity to seismicity parameter smoothing Cases A, B, and E for background sources only for 10 Hz SA and 1 Hz SA. These hazard curves assign a weight of unity to each smoothing case (for these plots only). The legends in these plots indicate the weight assigned in hazard calculations to each smoothing case.
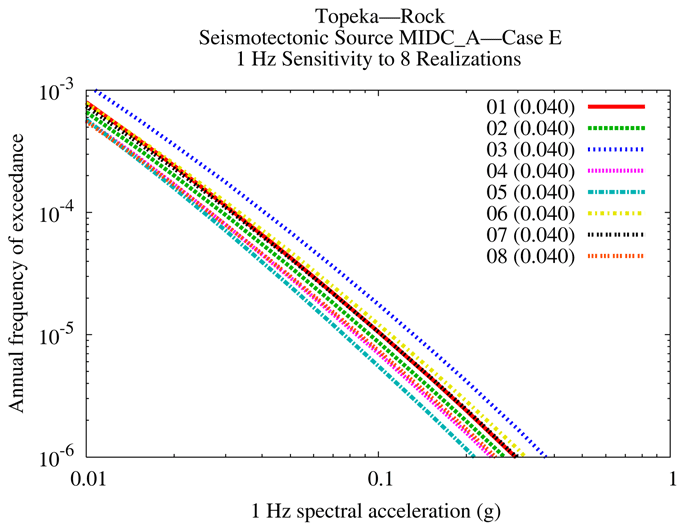
Figures bb, cc, and dd: Mean rock hazard sensitivity to the eight seismicity parameter realizations, for 10 Hz SA and smoothing Cases A, B, and E for background sources only. These hazard curves assign a weight of unity to each smoothing case (for these plots only). The legends in these plots indicate the weight assigned in hazard calculations to each realization.
Figures ee, ff, and gg: Sensitivity plots similar to the previous three, for 1 Hz SA.
Sensitivity to In-Cluster and Out-of-Cluster Assumption
The sensitivity of seismic hazard to the New Madrid fault in-cluster vs. out-of-cluster assumption is straightforward to determine. The mean in-cluster annual activity rate is 2.3 x 10⁻³ (over all in-cluster branches), the mean out-of-cluster annual activity rate is 5.0 x 10⁻⁴, which is a factor of 4.6 difference. Thus hazard curves for these two cases would differ by about a factor of 4.6 (this is approximate because the in-cluster model assumes multiple earthquakes, but the out-of-cluster model assumes only a single earthquake).
Hazard results are shown on Figures 8.2-1a through 8.2-1gg for the Central Illinois site. Figures 8.2-1a, 8.2-1b, and 8.2-1c show mean and fractile rock hazard curves for 10 Hz SA, 1 Hz SA, and PGA, respectively. Figure 8.2-1b shows that the mean rock hazard curve for 1 Hz SA lies close to the 0.85 fractile hazard curve at some amplitudes. This results from the contribution of the NMFS RLME source for 1 Hz SA, as discussed below.
Figures 8.2-1d and 8.2-1f show that for 10 Hz SA and PGA, background sources give the highest contributions to hazard. Among background sources, Figures 8.2-1g and 8.2-1i indicate that the highest contributions to 10 Hz SA and PGA hazard come from the MidC seismotectonic sources, the NMESE-N Mmax source, and the IBEB seismotectonic source. The MidC and NMESE-N sources are host sources, while the IBEB source is a major contributor to hazard because of its close proximity to the site and its weighted mean Mmax value of M 7.4. For comparison, the MidC seismotectonic zones have a weighted mean Mmax value of M 6.6, and the NMESE-N Mmax source has a weighted mean Mmax value of M 7.1.
For 1 Hz SA, Figure 8.2-1e shows that the NMFSRLME source dominates total rock hazard for ground motions up to about 0.33 g, and background sources dominate total rock hazard at higher amplitudes. Also note that the ERM-S RLME source has a higher hazard than the ERM-N RLME source, even though the ERM-N RLME source is closer to the site. This is caused by the ERM-S RLME source having a weighted mean Mmax of M 7.2 and the ERM-N RLME source having a weighted mean Mmax of M 6.9. Figure 8.2-1h shows the contribution to 1 Hz SA by background source.
When the NMFS dominates the hazard and lies a great distance from a site (in this case about 320 km, or 200 mi., from the Central Illinois site), the mean hazard often corresponds to a high fractile hazard curve (the 0.85 fractile or higher). The reason is that for the EPRI (2004, 2006) ground-motion model at great distances, one or a few equations within the EPRI (2004, 2006) model give high ground motions and dominate the mean hazard. These few equations have low weight, but their large contribution to the mean hazard results in a mean hazard that corresponds to a high fractile hazard curve.
Figures 8.2-1j and 8.2-1l show that the CEUS-SSC model results in higher rock hazard at the site than the COLA or USGS models for 10 Hz SA and PGA, respectively. This is caused by the IBEB source (mean Mmax of M 7.4) dominating the high-frequency hazard for the CEUS-SSC model at this site. The COLA and USGS mean values of Mmax for the area encompassed by the IBEB source are lower. Additionally, the IBEB source concentrates historical seismicity within the source boundaries, whereas large regional sources (of the COLA and USGS source models) allow seismicity to be smoothed over a wider region.
Figure 8.2-1k shows that the three seismic source models result in similar hazards for 1 Hz SA. The NMFS dominates rock hazard at 1 Hz SA, as discussed above, and the New Madrid sources are similar in all three models, resulting in similar hazard for 1 Hz SA.
Figures 8.2-1m through 8.2-1r indicate similar contributions by seismic source for shallow and deep soil as were found for rock. These figures show that for PGA and 10 Hz SA, background sources dominate the total soil hazard at the site. For 1 Hz SA, the NMFS RLME source dominates total soil hazard up to about 0.35 g (for shallow soil) or about 0.8 g (for deep soil). At higher amplitudes, background sources dominate the 1 Hz SA soil hazard.
Figure 8.2-1t shows that for 1 Hz SA, rock and shallow soil have similar total hazard at the site, but amplification caused by deep soil greatly increases the total hazard at the site. For 10 Hz SA and PGA (Figures 8.2-1s and 8.2-1u), shallow soil amplifies ground motions slightly, and deep soil deamplifies ground motions at the site, except for low PGA amplitudes. At PGA amplitudes less than 0.35 g, deep soil shows amplifications of ground motion (see Figure 8.1-5).
Sensitivity results for background sources (Figures 8.2-1v through 8.2-1gg) show the following:
- There is little difference in hazard between Mmax and seismotectonic sources.
- The hazard is sensitive to Mmax values for the IBEB seismotectonic source, which is expected.
- Smoothing Case E shows the highest hazard, followed by Cases B and A. This is consistent with seismicity rates in the IBEB seismotectonic source for these three smoothing cases.
- The hazard is sensitive to the eight realizations of seismicity parameters for the three smoothing cases, which is expected.
Hazard results are shown on Figures 8.2-2a through 8.2-2gg for the Chattanooga site. Figures 8.2-2a, 8.2-2b, and 8.2-2c show mean and fractile rock hazard curves for 10 Hz SA, 1 Hz SA, and PGA, respectively.
Figures 8.2-2d and 8.2-2f show that for 10 Hz SA and PGA, background sources give the highest contributions to rock hazard. Among background sources, Figures 8.2-2g and 8.2-2i indicate that the highest contributions to 10 Hz SA and PGA hazard come from the PEZ-N seismotectonic source and the NMESE-N Mmax source. Both sources are host sources.
For 1 Hz SA, Figure 8.2-2e shows that the NMFSRLME source dominates total rock hazard for ground motions up to about 0.15 g, and background sources dominate total rock hazard at higher amplitudes. However, even at amplitudes below 0.15 g, background sources have an important contribution to total hazard. Figure 8.2-2h shows the contribution to 1 Hz SA by background source.
Figures 8.2-2j and 8.2-2l show that the CEUS-SSC model and USGS model result in nearly identical hazards for lower amplitudes, but above about 0.6 and 0.3 g, the USGS model results in higher rock hazards for 10 Hz SA and PGA, respectively. This is related to the mean Mmax value for the USGS model for the region encompassing eastern Tennessee, which is higher than the mean Mmax values for this region in the CEUS-SSC and COLA models. Figure 8.2-2k shows that the CEUS-SSC model results in rock hazard at the site that lies between the hazard from the COLA and USGS models for 1 Hz SA. The difference in Mmax values between the source models also plays a role in the comparison of 1 Hz hazard.
Figures 8.2-2m through 8.2-2r indicate similar contributions by seismic source for shallow and deep soil as were found for rock. These figures show that for 10 Hz SA and PGA, background sources give the highest contributions to hazard. For 1 Hz SA, the NMFS dominates total hazard for ground motions up to about 0.15 g for shallow soil and 0.35 g for deep soil, and background sources dominate total hazard at higher amplitudes.
Figure 8.2-2t shows that for 1 Hz SA, rock and shallow soil have similar total hazard at the site, but amplification caused by deep soil greatly increases the total hazard at the site. For 10 Hz SA (Figure 8.2-2s), shallow soil amplifies ground motions slightly, and deep soil deamplifies ground motions at the site. The same is true for PGA (Figure 8.2-2u), except for amplitudes less than
0.35 g where deep soil shows amplification of ground motion (see Figure 8.1-5).
Sensitivity results for background sources (Figures 8.2-2v through 8.2-2gg) show the following:
- There is little difference in hazard between Mmax and seismotectonic sources.
- There is little sensitivity in hazard Mmax values for the PEZ-N seismotectonic source at 10 Hz SA, but at 1 Hz SA the sensitivity is more pronounced, which is expected.
- Smoothing Case A shows the highest hazard, followed by Cases B and E, and there is sensitivity to the three cases. This is consistent with seismicity rates in the PEZ-N seismotectonic source for these three smoothing cases.
- The hazard is sensitive to the eight realizations of seismicity parameters for the three smoothing cases, which is expected.
Hazard results are shown on Figures 8.2-3a through 8.2-3gg for the Houston site. Figures 8.2-3a, 8.2-3b, and 8.2-3c show mean and fractile rock hazard curves for 10 Hz SA, 1 Hz SA, and PGA, respectively. Figure 8.2-3b shows that the mean rock hazard lies above the 0.85 fractile between about 0.045 and 0.25 g. This results from the contribution of the NMFS RLME source at 1 Hz SA, which is discussed below.
Figures 8.2-3d and 8.2-3f show that for 10 Hz SA and PGA, background sources give the highest contributions to hazard except at low amplitudes. For 10 Hz SA amplitudes below about 0.03 g, and PGA amplitudes below about 0.015 g, the NMFS gives hazard that slightly exceeds that from background sources. Among background sources, Figures 8.2-3g and 8.2-3i indicate that the highest contributions to 10 Hz SA and PGA hazard come from the GHEX and ECC-GC seismotectonic sources and the MESE-N Mmax source. The GHEX and MESE-N are host sources, while ECC-GC is a major contributor to hazard because of its proximity to the site and its higher seismicity rate.
For 1 Hz SA, Figure 8.2-3e shows that the NMFSRLME source dominates total rock hazard for ground motions. When the NMFS dominates the hazard and lies a great distance from a site (in this case about 780 km, or 485 mi., from the Houston site), the mean hazard often corresponds to a high fractile hazard curve (the 0.85 fractile or higher). The reason is that for the EPRI (2004, 2006) ground-motion model at great distances, one or a few equations within the EPRI (2004, 2006) model give high ground motions and dominate the mean hazard. These few equations have low weight, but their large contribution to the mean hazard results in a mean hazard that corresponds to a high fractile hazard curve. Figure 8.2-3h shows the contribution to 1 Hz SA by background source.
Figures 8.2-3j and 8.2-3l show that hazard from the CEUS-SSC model lies between hazards from the COLA and USGS models for 10 Hz SA and PGA, respectively. Figure 8.2-3k shows that for 1 Hz SA, all three models result in similar rock hazard, up to approximately 0.05 g. At higher amplitudes, the USGS model results in higher rock hazard. The NMFS dominates rock hazard at 1 Hz SA, as discussed above, and the New Madrid sources are similar in all three models. Higher 1 Hz SA hazard from the USGS model at amplitudes above 0.05 g probably relates to the USGS treatment of background sources in the vicinity of Houston.
Figures 8.2-3m through 8.2-3r indicate similar contributions by seismic source for shallow and deep soil as were found for rock. These figures show that for 10 Hz SA and PGA, background sources give the highest contributions to hazard except at low amplitudes (less than about 0.04 g for 10 Hz SA for shallow and deep soil, and less than about 0.03 g for PGA for shallow and deep soil). At these low amplitudes the NMFS is the dominant contributor to hazard. For 1 Hz SA, the NMFS dominates total hazard for ground motions at all amplitudes, which was the conclusion for rock hazard (Figure 8.2-3e).
Figure 8.2-3t shows that for 1 Hz SA, rock and shallow soil have similar total hazard at the site, but amplification caused by the deep soil greatly increases the total hazard at the site. For 10 Hz SA and PGA (Figures 8.2-3s and 8.2-3u), shallow soil amplifies ground motions slightly, while deep soil hazard exhibits deamplification above about 0.35 g (for PGA) and 0.09 g (for 10 Hz SA), and amplification below those amplitudes. This is consistent with the amplification factor for deep soil (Figure 8.1-5).
Sensitivity results for background sources (Figures 8.2-3v through 8.2-3gg) show the following:
- Hazard from the seismotectonic sources exceeds that of the Mmax sources because of the higher seismicity rate of seismotectonic source ECC-GC and its close proximity to the site.
- There is little sensitivity of hazard to Mmax values for the GHEX seismotectonic source at 10 Hz SA, but at 1 Hz SA the sensitivity is slightly more pronounced, which is expected.
- Smoothing Cases A and E show the highest hazard, followed by Case B. This is consistent with seismicity rates in the GHEX source for these three smoothing cases.
- The hazard is sensitive to the eight realizations of seismicity parameters for the three smoothing cases, which is expected. The hazard is especially sensitive to the eight realizations for Case B, as seen for 10 Hz and 1 Hz SA, where two of the eight realizations indicate very low seismicity near the site.
Hazard results are shown on Figures 8.2-4a through 8.2-4gg for the Jackson site. Figures 8.2-4a, 8.2-4b, and 8.2-4c show the mean and fractile rock hazard curves for 10 Hz SA, 1 Hz SA, and PGA, respectively. Figure 8.2-4b shows the mean rock hazard overlapping the 0.85 fractile hazard between about 0.2 and 0.32 g. This results from the contribution of the NMFS RLME source at 1 Hz SA, which is discussed below.
For 10 Hz SA and PGA, Figures 8.2-4d and 8.2-4f show that the NMFS is the highest contributor to hazard at amplitudes below 0.35 g (for 10 Hz SA) and 0.15 g (for PGA). Above these amplitudes, the highest contribution to total hazard comes from the background sources. Among background sources, Figures 8.2-4g and 8.2-4i indicate that the highest contributions to 10 Hz SA and PGA hazard come from the ECC-GC seismotectonic source, and at lower amplitudes, from the RR and RR-RCG seismotectonic sources. ECC-GC is the host source, while the RR and RR-RCG sources are a major contributor to low-amplitude hazard because of the use of midcontinent attenuation equations for these sources, whereas Gulf attenuation equations are used for all other background sources.
For 1 Hz SA, Figure 8.2-4e shows that the NMFS RLME source dominates total rock hazard for ground motions. When the NMFS dominates the hazard and lies a great distance from a site (in this case about 360 km, or 225 mi., from the Jackson site), the mean hazard often corresponds to a high fractile hazard curve (the 0.85 fractile or higher). The reason is that for the EPRI (2004, 2006) ground-motion model at great distances, one or a few equations within the EPRI (2004, 2006) model give high ground motions and dominate the mean hazard. These few equations have low weight, but their large contribution to the mean hazard results in a mean hazard that corresponds to a high fractile hazard curve. Figure 8.2-4h shows the contribution to 1 Hz SA by background source.
Figures 8.2-4j and 8.2-4l show that the CEUS-SSC model results in 10 Hz SA and PGA hazard that lies between the hazards from the COLA and USGS models. Figure 8.2-4k indicates that for 1 Hz SA, all three models have similar rock hazard up to approximately 0.15 g. Above that amplitude the USGS model indicates somewhat higher rock hazard. The NMFS dominates rock hazard at 1 Hz SA, as discussed above, and the New Madrid sources are similar in all three models, resulting in similar hazard for 1 Hz SA.
Figures 8.2-4m through 8.2-4r indicate similar contributions by seismic source for shallow and deep soil to those found for rock. That is, for 10 Hz SA and PGA, background sources dominate the total soil hazard at higher ground-motion amplitudes, while at lower amplitudes the NMFS dominates. For 1 Hz SA, the NMFS RLME source dominates total hazard for both shallow and deep soil.
Figures 8.2-4s through 8.2-4u show that at 10 Hz SA, there is slight amplification of shallow soil and a deamplification of deep soil. At 1 Hz SA, rock and shallow soil have similar total hazard at the site, but amplification caused by the deep soil greatly increases the total hazard at the site. For PGA, shallow soil amplifies ground motions, resulting in a higher hazard curve. Deep soil deamplifies ground motions for PGA above 0.35 g, resulting in a lower hazard curve, and the opposite is true for PGA below about 0.35 g. This is consistent with the deep soil amplification factor (Figure 8.1-5).
Sensitivity results for background sources (Figures 8.2-4v through 8.2-4gg) show the following:
- Hazard from the seismotectonic sources exceeds hazard from the Mmax sources because seismicity rates in the seismotectonic sources (specifically, the ECC-GC source) are higher than for Mmax sources (specifically, the MESE-N).
- There is little sensitivity in hazard Mmax values for the ECC-GC seismotectonic source at 10 Hz SA, but at 1 Hz SA the sensitivity is slightly more pronounced, which is expected.
- Smoothing Cases A, B, and E show very similar hazard for 10 Hz SA and 1 Hz SA.
- Seismic hazard is sensitive to the eight realizations of seismicity parameters for Case A, with one realization indicating very low hazard (very low rates of seismicity). There is less sensitivity to the eight realizations for Cases B and E.
Hazard results are shown on Figures 8.2-5a through 8.2-5gg for the Manchester site. Figures 8.2-5a, 8.2-5b, and 8.2-5c show the mean and fractile rock hazard curves for 10 Hz SA, 1 Hz SA, and PGA, respectively.
Figures 8.2-5d through 8.2-5f show that for 10 Hz SA, 1 Hz SA, and PGA, the background sources are the highest contributor to hazard. The only RLME modeled for the Manchester hazard is the Charlevoix RLME, but its great distance (about 440 km, or 275 mi.) from the site means that it makes only a minor contribution to hazard at any frequency. Among background sources, Figures 8.2-5g and 8.2-5i indicate that the highest contribution to 10 Hz SA and PGA hazard comes from the NAP seismotectonic source, which is a host source. MESE-N and STUDY-R make the largest contributions of the Mmax sources. Figure 8.2-5h shows the contribution to 1 Hz SA by background source.
Figures 8.2-5j and 8.2-5l show that for 10 Hz SA and PGA, the CEUS-SSC model results in hazard similar to that of the COLA model. The USGS model indicates similar hazard at low amplitudes, but above about 0.5 g for 10 Hz SA and 0.35 g for PGA, the USGS model results in higher hazard. Figure 8.2-5k shows that for 1 Hz SA, the CEUS-SSC model results in somewhat higher hazard than the COLA model, but (at amplitudes exceeding about 0.03 g) the USGS model results in the highest hazard between the three.
Figures 8.2-5m through 8.2-5r indicate similar contributions from background sources for shallow and deep soil as were found for rock. These figures show that for 10 Hz SA, 1 Hz SA, and PGA, background sources dominate the total soil hazard at the site, and that the Charlevoix RLME is not a large contributor to hazard because of its great distance from the site.
Figure 8.2-5t shows that for 1 Hz SA, rock and shallow soil have similar total hazard at the site, but amplification caused by the deep soil greatly increases the total hazard at the site. For 10 Hz SA and PGA (Figures 8.2-5s and 8.2-5u), shallow soil amplifies ground motions slightly, and deep soil deamplifies ground motions at the site, except for low PGA amplitudes. At PGA amplitudes less than 0.35 g, deep soil shows amplifications of ground motion (see Figure 8.1-5).
Sensitivity results for background sources (Figures 8.2-5v through 8.2-5gg) show the following:
- Mmax and seismotectonic sources indicate very similar hazards.
- There is little sensitivity in hazard Mmax values for the NAP seismotectonic source at 10 Hz SA, but at 1 Hz SA the sensitivity is slightly more pronounced, which is expected.
- Smoothing Case A shows the highest hazard, followed by Cases B and E. This is consistent with seismicity rates in the NAP seismotectonic source for these three smoothing cases.
- The hazard is sensitive to the eight realizations for the three smoothing cases, which is expected. The hazard is somewhat more sensitive to the eight realizations for Case B than for Cases A and E.
Hazard results are shown on Figures 8.2-6a through 8.2-6gg for the Savannah site. Figures 8.2-6a, 8.2-6b, and 8.2-6c show mean and fractile rock hazard curves for 10 Hz SA, 1 Hz SA, and PGA, respectively.
Figures 8.2-6d and 8.2-6f show that for 10 Hz SA and PGA, the Charleston RLME is the highest contributor to rock hazard, but background sources contribute significantly at higher amplitudes. For PGA, at amplitudes higher than about 1.25 g, background sources indicate the highest contribution to hazard. Among background sources, Figures 8.2-6g through 8.2-6i indicate that the highest contribution comes from the ECC-AM seismotectonic source for 10 Hz SA, 1 Hz SA, and PGA. MESE-N makes the largest contribution of the Mmax sources. ECC-AM and MESE-N are both host sources.
For 1 Hz SA, Figure 8.2-6e shows that the Charleston RLME dominates total rock hazard for all amplitudes and that the background sources are less significant contributors than for 10 Hz SA or PGA.
Figures 8.2-6j through 8.2-6l show that the CEUS-SSC model produces higher hazard at Savannah than the COLA and USGS models, except at higher amplitudes (above 1.8, 0.45, and 0.8 g for 10 Hz SA, 1 Hz SA, and PGA, respectively) where the USGS model shows higher hazard. This is primarily a result of differences in Charleston source geometries between the three models, which have an important effect at a very close site like Savannah. For a more distant site, hazard resulting from the three models is expected to be similar. In particular, sites located to the northwest would lie perpendicular to predominant rupture orientations in the Charleston RLME and would not be highly affected by assumptions on source geometries.
Figures 8.2-6m through 8.2-6r indicate similar contributions by seismic source for shallow and deep soil as were found for rock. These figures show that for 10 Hz SA and PGA, the Charleston RLME is the highest contributor to hazard, and background sources contribute significantly at higher amplitudes. For 1 Hz SA, the background sources are less significant contributors to hazard than at 10 Hz SA or PGA.
Figures 8.2-6s through 8.2-6u show that at 10 Hz SA, there is slight amplification of shallow soil and a deamplification of deep soil. At 1 Hz SA, rock and shallow soil have similar total hazard at the site, but amplification caused by the deep soil greatly increases the total hazard at the site. For PGA, shallow soil shows higher hazard than rock, while deep soil shows lower hazard than rock above about 0.35 g and higher hazard below that amplitude. This is consistent with the deep soil amplification factor for PGA (Figure 8.1-5).
Sensitivity results for background sources (Figures 8.2-6v through 8.2-6gg) show the following:
- There is little difference in hazard between Mmax and seismotectonic sources.
- There is little sensitivity in hazard Mmax values for the ECC-AM seismotectonic source at 10 Hz SA, but at 1 Hz SA the sensitivity is slightly more pronounced, which is expected.
- Smoothing Case A shows the highest hazard, followed by Cases E and B. This is consistent with seismicity rates in the ECC-AM seismotectonic source for these three smoothing cases.
- The hazard is sensitive to the eight realizations of seismicity parameters for the three smoothing cases, which is expected.
Hazard results are shown on Figures 8.2-7a through 8.2-7gg for the Topeka site. Figures 8.2-7a, 8.2-7b, and 8.2-7c show the mean and fractile rock hazard curves for 10 Hz SA, 1 Hz SA, and PGA, respectively. Figure 8.2-7b shows the mean rock hazard being equivalent to the 0.85 fractile between about 0.1 and 0.15 g. This results from the contribution of the NMFS RLME source at 1 Hz SA, which is discussed below.
For 10 Hz SA and PGA, Figures 8.2-7d and 8.2-7f show that background sources give the highest contributions to hazard. Among background sources, Figures 8.2-7g and 8.2-7i indicate that the highest contributions come from the MidC-A seismotectonic source, the NMESE-N Mmax sources, and the STUDY-R Mmax source. All of these are host sources.
For 1 Hz SA, Figure 8.2-7e shows that the NMFSRLME source dominates total rock hazard for ground motions up to about 0.2 g, and background sources dominate total rock hazard at higher amplitudes. When the NMFS dominates the hazard and lies a great distance from a site (in this case about 580 km, or 360 mi., from the Topeka site), the mean hazard often corresponds to a high fractile hazard curve (the 0.85 fractile or higher). The reason is that for the EPRI (2004, 2006) ground-motion model at great distances, one or a few equations within the EPRI (2004, 2006) model give high ground motions and dominate the mean hazard. These few equations have low weight, but their large contribution to the mean hazard results in a mean hazard that corresponds to a high fractile hazard curve. Contribution by background source for 1 Hz SA is shown on Figure 8.2-7h.
Figures 8.2-7j and 8.2-7l show that the CEUS-SSC model results in slightly higher rock hazard at the site than the COLA or USGS models for 10 Hz SA and PGA, respectively. Figure 8.2-7k shows that for 1 Hz SA, hazards resulting from the three models are very similar. The NMFS dominates rock hazard at 1 Hz SA, as discussed above, and the New Madrid sources are similar in all three models, resulting in similar hazard for 1 Hz SA.
Figures 8.2-7m through 8.2-7r indicate similar contributions by seismic source for shallow and deep soil as were found for rock. These figures show that for 10 Hz SA and PGA, background sources give the highest contributions to hazard. For 1 Hz SA, the NMFS dominates total hazard for ground motions up to about 0.25 g for shallow soil and 0.55 g for deep soil, and background sources dominate total hazard at higher amplitudes.
Figures 8.2-7s through 8.2-7u show that at 10 Hz SA, there is a slight amplification of shallow soil and a deamplification of deep soil. At 1 Hz SA, rock and shallow soil have similar total hazard at the site, but amplification caused by the deep soil greatly increases the total hazard at the site. For PGA, shallow soil is amplified, but deep soil shows lower hazard than rock above about 0.35 g, and higher hazard below this amplitude. This is consistent with the deep soil amplification factor for PGA (Figure 8.1-5).
Sensitivity results for background sources (Figures 8.2-7v through 8.2-7gg) show the following:
- Mmax sources indicate higher hazard than seismotectonic sources. The maximum magnitudes and local seismicity rates in Mmax sources are higher than the corresponding values in seismotectonic sources, which explains this difference.
- There is a moderate sensitivity in hazard Mmax values for the MidC-A seismotectonic source at 10 Hz SA, but at 1 Hz SA the sensitivity is more pronounced, which is expected.
- Smoothing Case B shows the highest hazard, followed by Cases E and A. This is consistent with seismicity rates in the MidC-A seismotectonic source for these three smoothing cases.
- The hazard is sensitive to the eight realizations of seismicity parameters for the three smoothing cases, which is expected. The hazard is especially sensitivity to the eight realizations for Case A, as seen for 10 Hz and 1 Hz SA.
Table 8.1-1
Description of Seven Test Sites
| Test Site Name | N. Latitude | W. Longitude | Reason for Selection |
|---|---|---|---|
| Central Illinois | 40.000 |
-90.000 |
Hazard from New Madrid seismic zone and paleoearthquake zones in central Illinois |
| Chattanooga | 35.064 |
-85.255 |
Hazard from Eastern Tennessee seismic zone |
| Houston | 29.760 |
-95.363 |
Hazard in Gulf Coast region |
| Jackson | 32.312 |
-90.178 |
Hazard from New Madrid seismic zone |
| Manchester | 42.991 |
-71.463 |
Hazard in New England |
| Savannah | 32.082 |
-81.097 |
Hazard from Charleston source |
| Topeka | 39.047 |
-95.682 |
Hazard in central plains region |
Table 8.2.1-1
Mean and Select Fractiles for Rock Hazard at Central Illinois: Digital Data for Figures 8.2-1a through 8.2-1c
| Frequency | Spectral Accel. (g) | Mean | 0.15 | 0.5 | 0.85 |
|---|---|---|---|---|---|
| 10 Hz | 0.1 |
1.27E-3 |
4.37E-4 |
9.33E-4 |
2.00E-3 |
0.15 |
5.98E-4 |
1.91E-4 |
4.07E-4 |
9.33E-4 |
|
0.2 |
3.37E-4 |
1.06E-4 |
2.34E-4 |
5.01E-4 |
|
0.3 |
1.45E-4 |
4.47E-5 |
1.02E-4 |
2.04E-4 |
|
0.5 |
4.91E-5 |
1.59E-5 |
3.63E-5 |
7.76E-5 |
|
0.7 |
2.44E-5 |
7.41E-6 |
1.82E-5 |
3.89E-5 |
|
1 |
1.16E-5 |
3.47E-6 |
9.12E-6 |
1.95E-5 |
|
1.5 |
4.79E-6 |
1.32E-6 |
3.47E-6 |
8.51E-6 |
|
2 |
2.45E-6 |
6.17E-7 |
1.74E-6 |
4.27E-6 |
|
3 |
8.61E-7 |
1.78E-7 |
5.75E-7 |
1.62E-6 |
|
5 |
1.90E-7 |
2.75E-8 |
1.10E-7 |
3.55E-7 |
|
7 |
6.14E-8 |
6.68E-9 |
3.16E-8 |
1.18E-7 |
|
10 |
1.64E-8 |
1.23E-9 |
7.41E-9 |
3.06E-8 |
|
| 1 Hz | 0.01 |
4.48E-3 |
1.86E-3 |
3.72E-3 |
7.16E-3 |
0.015 |
2.90E-3 |
1.00E-3 |
2.46E-3 |
4.90E-3 |
|
0.02 |
2.08E-3 |
6.17E-4 |
1.62E-3 |
3.72E-3 |
|
0.03 |
1.21E-3 |
2.69E-4 |
8.13E-4 |
2.29E-3 |
|
0.05 |
5.16E-4 |
7.76E-5 |
2.69E-4 |
9.33E-4 |
|
0.07 |
2.62E-4 |
3.16E-5 |
1.10E-4 |
4.37E-4 |
|
0.1 |
1.15E-4 |
1.12E-5 |
4.17E-5 |
1.66E-4 |
|
0.15 |
4.00E-5 |
3.24E-6 |
1.29E-5 |
5.13E-5 |
|
0.2 |
1.75E-5 |
1.32E-6 |
5.25E-6 |
2.09E-5 |
|
0.3 |
5.02E-6 |
3.43E-7 |
1.51E-6 |
6.46E-6 |
|
0.5 |
9.67E-7 |
5.13E-8 |
3.31E-7 |
1.51E-6 |
|
0.7 |
3.29E-7 |
1.38E-8 |
1.14E-7 |
5.75E-7 |
|
1 |
1.07E-7 |
3.24E-9 |
3.39E-8 |
2.04E-7 |
|
| PGA | 0.1 |
3.27E-4 |
8.32E-5 |
2.04E-4 |
5.01E-4 |
0.15 |
1.42E-4 |
3.89E-5 |
9.55E-5 |
2.04E-4 |
|
0.2 |
7.90E-5 |
2.24E-5 |
5.50E-5 |
1.18E-4 |
|
0.3 |
3.56E-5 |
1.05E-5 |
2.57E-5 |
5.89E-5 |
|
0.5 |
1.34E-5 |
3.47E-6 |
9.77E-6 |
2.40E-5 |
|
0.7 |
6.93E-6 |
1.51E-6 |
4.57E-6 |
1.29E-5 |
|
1 |
3.23E-6 |
5.75E-7 |
2.00E-6 |
6.03E-6 |
|
1.5 |
1.22E-6 |
1.55E-7 |
6.17E-7 |
2.29E-6 |
|
2 |
5.55E-7 |
5.31E-8 |
2.51E-7 |
1.00E-6 |
|
3 |
1.58E-7 |
9.77E-9 |
5.89E-8 |
2.69E-7 |
|
5 |
2.40E-8 |
7.59E-10 |
6.46E-9 |
3.89E-8 |
|
7 |
5.68E-9 |
1.10E-10 |
1.23E-9 |
8.51E-9 |
|
10 |
1.03E-9 |
1.20E-11 |
1.72E-10 |
1.41E-9 |
Table 8.2.2-1
Mean and Select Fractiles for Rock Hazard at Chattanooga: Digital Data for Figures 8.2-2a through 8.2-2c
| Frequency | Spectral Accel. (g) | Mean | 0.15 | 0.5 | 0.85 |
|---|---|---|---|---|---|
| 10 Hz | 0.1 |
1.77E-3 |
6.61E-4 |
1.41E-3 |
2.82E-3 |
0.15 |
9.63E-4 |
3.55E-4 |
7.08E-4 |
1.62E-3 |
|
0.2 |
6.17E-4 |
2.19E-4 |
4.37E-4 |
1.07E-3 |
|
0.3 |
3.25E-4 |
1.10E-4 |
2.19E-4 |
5.75E-4 |
|
0.5 |
1.41E-4 |
4.62E-5 |
8.91E-5 |
2.69E-4 |
|
0.7 |
7.85E-5 |
2.40E-5 |
5.13E-5 |
1.45E-4 |
|
1 |
4.04E-5 |
1.20E-5 |
2.57E-5 |
7.76E-5 |
|
1.5 |
1.75E-5 |
4.90E-6 |
1.12E-5 |
3.16E-5 |
|
2 |
9.08E-6 |
2.29E-6 |
5.62E-6 |
1.70E-5 |
|
3 |
3.23E-6 |
7.08E-7 |
1.86E-6 |
5.62E-6 |
|
5 |
7.12E-7 |
1.26E-7 |
3.80E-7 |
1.32E-6 |
|
7 |
2.29E-7 |
3.16E-8 |
1.18E-7 |
4.07E-7 |
|
10 |
6.04E-8 |
6.46E-9 |
2.75E-8 |
1.10E-7 |
|
| 1 Hz | 0.01 |
5.39E-3 |
2.29E-3 |
4.57E-3 |
8.51E-3 |
0.015 |
3.40E-3 |
1.23E-3 |
2.82E-3 |
5.62E-3 |
|
0.02 |
2.38E-3 |
7.08E-4 |
1.86E-3 |
4.27E-3 |
|
0.03 |
1.34E-3 |
3.31E-4 |
9.33E-4 |
2.46E-3 |
|
0.05 |
5.64E-4 |
1.02E-4 |
3.31E-4 |
1.00E-3 |
|
0.07 |
2.90E-4 |
4.47E-5 |
1.45E-4 |
4.68E-4 |
|
0.1 |
1.33E-4 |
1.82E-5 |
6.10E-5 |
2.04E-4 |
|
0.15 |
5.06E-5 |
6.03E-6 |
2.16E-5 |
7.76E-5 |
|
0.2 |
2.45E-5 |
2.82E-6 |
1.05E-5 |
3.89E-5 |
|
0.3 |
8.50E-6 |
8.13E-7 |
3.72E-6 |
1.43E-5 |
|
0.5 |
2.18E-6 |
1.45E-7 |
9.33E-7 |
3.98E-6 |
|
0.7 |
8.76E-7 |
4.17E-8 |
3.55E-7 |
1.68E-6 |
|
1 |
3.19E-7 |
1.01E-8 |
1.10E-7 |
6.17E-7 |
|
| PGA | 0.1 |
6.36E-4 |
2.04E-4 |
4.37E-4 |
1.07E-3 |
0.15 |
3.44E-4 |
1.10E-4 |
2.19E-4 |
6.17E-4 |
|
0.2 |
2.21E-4 |
6.76E-5 |
1.45E-4 |
4.07E-4 |
|
0.3 |
1.17E-4 |
3.39E-5 |
7.24E-5 |
2.19E-4 |
|
0.5 |
4.88E-5 |
1.20E-5 |
3.06E-5 |
8.91E-5 |
|
0.7 |
2.58E-5 |
5.62E-6 |
1.59E-5 |
4.79E-5 |
|
1 |
1.22E-5 |
2.14E-6 |
6.92E-6 |
2.24E-5 |
|
1.5 |
4.60E-6 |
6.17E-7 |
2.29E-6 |
8.51E-6 |
|
2 |
2.10E-6 |
2.19E-7 |
9.02E-7 |
3.72E-6 |
|
3 |
5.93E-7 |
4.17E-8 |
2.19E-7 |
1.00E-6 |
|
5 |
8.95E-8 |
3.72E-9 |
2.40E-8 |
1.35E-7 |
|
7 |
2.10E-8 |
5.56E-10 |
4.57E-9 |
3.06E-8 |
|
10 |
3.75E-9 |
5.89E-11 |
6.17E-10 |
5.25E-9 |
Table 8.2.3-1
Mean and Select Fractiles for Rock Hazard at Houston: Digital Data for Figures 8.2-3a through 8.2-3c
| Frequency | Spectral Accel. (g) | Mean | 0.15 | 0.5 | 0.85 |
|---|---|---|---|---|---|
| 10 Hz | 0.01 |
1.77E-3 |
5.01E-4 |
1.23E-3 |
3.24E-3 |
0.015 |
1.13E-3 |
2.88E-4 |
7.08E-4 |
2.07E-3 |
|
0.02 |
7.90E-4 |
1.91E-4 |
4.37E-4 |
1.41E-3 |
|
0.03 |
4.49E-4 |
1.02E-4 |
2.34E-4 |
7.08E-4 |
|
0.05 |
2.08E-4 |
4.47E-5 |
1.10E-4 |
2.51E-4 |
|
0.07 |
1.22E-4 |
2.57E-5 |
6.31E-5 |
1.35E-4 |
|
0.1 |
6.68E-5 |
1.43E-5 |
3.63E-5 |
7.24E-5 |
|
0.15 |
3.19E-5 |
7.41E-6 |
1.95E-5 |
3.76E-5 |
|
0.2 |
1.85E-5 |
4.57E-6 |
1.20E-5 |
2.40E-5 |
|
0.3 |
8.74E-6 |
2.29E-6 |
6.92E-6 |
1.29E-5 |
|
0.5 |
3.60E-6 |
9.02E-7 |
3.02E-6 |
6.03E-6 |
|
0.7 |
2.03E-6 |
4.68E-7 |
1.74E-6 |
3.47E-6 |
|
1 |
1.08E-6 |
2.34E-7 |
9.33E-7 |
1.86E-6 |
|
| 1 Hz | 0.01 |
1.07E-3 |
1.26E-4 |
5.75E-4 |
2.14E-3 |
0.015 |
6.30E-4 |
5.31E-5 |
2.51E-4 |
1.23E-3 |
|
0.02 |
4.09E-4 |
2.95E-5 |
1.26E-4 |
7.08E-4 |
|
0.03 |
2.07E-4 |
1.20E-5 |
4.79E-5 |
2.79E-4 |
|
0.05 |
7.82E-5 |
3.72E-6 |
1.38E-5 |
6.76E-5 |
|
0.07 |
3.82E-5 |
1.74E-6 |
6.46E-6 |
2.57E-5 |
|
0.1 |
1.63E-5 |
7.59E-7 |
2.82E-6 |
1.01E-5 |
|
0.15 |
5.45E-6 |
2.88E-7 |
1.15E-6 |
3.98E-6 |
|
0.2 |
2.35E-6 |
1.45E-7 |
6.17E-7 |
2.14E-6 |
|
0.3 |
6.92E-7 |
5.13E-8 |
2.51E-7 |
8.71E-7 |
|
0.5 |
1.59E-7 |
1.20E-8 |
7.24E-8 |
2.69E-7 |
|
0.7 |
6.42E-8 |
3.98E-9 |
3.16E-8 |
1.26E-7 |
|
1 |
2.47E-8 |
1.15E-9 |
1.12E-8 |
5.13E-8 |
|
| PGA | 0.01 |
7.82E-4 |
1.55E-4 |
3.80E-4 |
1.41E-3 |
0.015 |
4.35E-4 |
8.32E-5 |
1.91E-4 |
6.61E-4 |
|
0.02 |
2.77E-4 |
5.13E-5 |
1.26E-4 |
3.80E-4 |
|
0.03 |
1.45E-4 |
2.66E-5 |
6.31E-5 |
1.78E-4 |
|
0.05 |
6.17E-5 |
1.12E-5 |
2.95E-5 |
6.76E-5 |
|
0.07 |
3.33E-5 |
6.92E-6 |
1.82E-5 |
3.89E-5 |
|
0.1 |
1.70E-5 |
3.85E-6 |
1.12E-5 |
2.32E-5 |
|
0.15 |
8.35E-6 |
2.00E-6 |
6.46E-6 |
1.29E-5 |
|
0.2 |
5.26E-6 |
1.27E-6 |
4.27E-6 |
8.51E-6 |
|
0.3 |
2.82E-6 |
6.61E-7 |
2.29E-6 |
4.90E-6 |
|
0.5 |
1.26E-6 |
2.34E-7 |
1.00E-6 |
2.29E-6 |
|
0.7 |
7.03E-7 |
1.06E-7 |
5.01E-7 |
1.32E-6 |
|
1 |
3.56E-7 |
4.17E-8 |
2.27E-7 |
6.61E-7 |
Table 8.2.4-1
Mean and Select Fractiles for Rock Hazard at Jackson: Digital Data for Figures 8.2-4a through 8.2-4c
| Frequency | Spectral Accel. (g) | Mean | 0.15 | 0.5 | 0.85 |
|---|---|---|---|---|---|
| 10 Hz | 0.1 |
4.85E-4 |
8.32E-5 |
2.69E-4 |
8.71E-4 |
0.15 |
2.27E-4 |
3.89E-5 |
1.10E-4 |
3.55E-4 |
|
0.2 |
1.25E-4 |
2.16E-5 |
5.89E-5 |
1.78E-4 |
|
0.3 |
5.06E-5 |
9.77E-6 |
2.57E-5 |
6.31E-5 |
|
0.5 |
1.54E-5 |
3.47E-6 |
9.77E-6 |
2.02E-5 |
|
0.7 |
7.21E-6 |
1.68E-6 |
5.25E-6 |
1.05E-5 |
|
1 |
3.35E-6 |
7.59E-7 |
2.63E-6 |
5.25E-6 |
|
1.5 |
1.42E-6 |
2.88E-7 |
1.15E-6 |
2.46E-6 |
|
2 |
7.51E-7 |
1.35E-7 |
6.17E-7 |
1.32E-6 |
|
3 |
2.82E-7 |
4.32E-8 |
2.04E-7 |
5.01E-7 |
|
5 |
6.80E-8 |
7.41E-9 |
4.47E-8 |
1.26E-7 |
|
7 |
2.34E-8 |
2.00E-9 |
1.38E-8 |
4.32E-8 |
|
10 |
6.62E-9 |
3.94E-10 |
3.47E-9 |
1.29E-8 |
|
| 1 Hz | 0.01 |
2.51E-3 |
8.13E-4 |
2.14E-3 |
4.27E-3 |
0.015 |
1.80E-3 |
4.37E-4 |
1.41E-3 |
3.24E-3 |
|
0.02 |
1.35E-3 |
2.51E-4 |
9.33E-4 |
2.63E-3 |
|
0.03 |
8.18E-4 |
1.10E-4 |
4.68E-4 |
1.62E-3 |
|
0.05 |
3.56E-4 |
3.06E-5 |
1.45E-4 |
6.61E-4 |
|
0.07 |
1.82E-4 |
1.25E-5 |
5.89E-5 |
2.99E-4 |
|
0.1 |
8.04E-5 |
4.57E-6 |
2.16E-5 |
1.10E-4 |
|
0.15 |
2.79E-5 |
1.51E-6 |
6.92E-6 |
3.06E-5 |
|
0.2 |
1.21E-5 |
7.08E-7 |
3.02E-6 |
1.20E-5 |
|
0.3 |
3.40E-6 |
2.19E-7 |
9.33E-7 |
3.47E-6 |
|
0.5 |
6.42E-7 |
4.17E-8 |
2.34E-7 |
8.71E-7 |
|
0.7 |
2.22E-7 |
1.25E-8 |
9.55E-8 |
3.67E-7 |
|
1 |
7.58E-8 |
3.35E-9 |
3.16E-8 |
1.45E-7 |
|
| PGA | 0.01 |
3.35E-3 |
1.23E-3 |
2.82E-3 |
5.25E-3 |
0.015 |
2.34E-3 |
7.08E-4 |
1.86E-3 |
3.98E-3 |
|
0.02 |
1.74E-3 |
4.37E-4 |
1.23E-3 |
3.24E-3 |
|
0.03 |
1.05E-3 |
2.04E-4 |
6.38E-4 |
2.00E-3 |
|
0.05 |
4.64E-4 |
6.76E-5 |
2.19E-4 |
8.71E-4 |
|
0.07 |
2.43E-4 |
3.63E-5 |
1.02E-4 |
4.07E-4 |
|
0.1 |
1.14E-4 |
1.76E-5 |
4.79E-5 |
1.66E-4 |
|
0.15 |
4.54E-5 |
7.94E-6 |
2.24E-5 |
5.89E-5 |
|
0.2 |
2.35E-5 |
4.73E-6 |
1.38E-5 |
2.95E-5 |
|
0.3 |
9.78E-6 |
2.14E-6 |
6.92E-6 |
1.38E-5 |
|
0.5 |
3.69E-6 |
7.33E-7 |
2.82E-6 |
6.46E-6 |
|
0.7 |
2.00E-6 |
3.55E-7 |
1.41E-6 |
3.72E-6 |
|
1 |
1.00E-6 |
1.45E-7 |
6.61E-7 |
1.86E-6 |
Table 8.2.5-1
Mean and Select Fractiles for Rock Hazard at Manchester: Digital Data for Figures 8.2-5a through 8.2-5c
| Frequency | Spectral Accel. (g) | Mean | 0.15 | 0.5 | 0.85 |
|---|---|---|---|---|---|
| 10 Hz | 0.1 |
9.79E-4 |
5.19E-4 |
8.71E-4 |
1.41E-3 |
0.15 |
5.46E-4 |
2.69E-4 |
5.01E-4 |
8.13E-4 |
|
0.2 |
3.56E-4 |
1.78E-4 |
3.09E-4 |
5.37E-4 |
|
0.3 |
1.92E-4 |
8.91E-5 |
1.66E-4 |
2.88E-4 |
|
0.5 |
8.50E-5 |
3.39E-5 |
7.24E-5 |
1.35E-4 |
|
0.7 |
4.80E-5 |
1.82E-5 |
4.17E-5 |
7.76E-5 |
|
1 |
2.51E-5 |
8.51E-6 |
2.09E-5 |
4.17E-5 |
|
1.5 |
1.11E-5 |
3.47E-6 |
8.51E-6 |
1.95E-5 |
|
2 |
5.84E-6 |
1.62E-6 |
4.57E-6 |
1.01E-5 |
|
3 |
2.14E-6 |
5.19E-7 |
1.51E-6 |
3.72E-6 |
|
5 |
4.96E-7 |
9.55E-8 |
3.20E-7 |
8.71E-7 |
|
7 |
1.66E-7 |
2.57E-8 |
9.89E-8 |
2.99E-7 |
|
10 |
4.57E-8 |
5.62E-9 |
2.40E-8 |
8.32E-8 |
|
| 1 Hz | 0.01 |
2.62E-3 |
9.33E-4 |
1.86E-3 |
4.42E-3 |
0.015 |
1.43E-3 |
4.68E-4 |
1.00E-3 |
2.37E-3 |
|
0.02 |
9.02E-4 |
2.88E-4 |
6.38E-4 |
1.51E-3 |
|
0.03 |
4.54E-4 |
1.35E-4 |
3.09E-4 |
7.59E-4 |
|
0.05 |
1.79E-4 |
4.79E-5 |
1.26E-4 |
2.88E-4 |
|
0.07 |
9.45E-5 |
2.40E-5 |
6.76E-5 |
1.55E-4 |
|
0.1 |
4.69E-5 |
1.05E-5 |
3.27E-5 |
8.04E-5 |
|
0.15 |
2.08E-5 |
4.27E-6 |
1.38E-5 |
3.63E-5 |
|
0.2 |
1.15E-5 |
2.14E-6 |
7.94E-6 |
2.09E-5 |
|
0.3 |
4.89E-6 |
7.59E-7 |
3.13E-6 |
9.77E-6 |
|
0.5 |
1.56E-6 |
1.78E-7 |
8.71E-7 |
3.13E-6 |
|
0.7 |
6.91E-7 |
5.89E-8 |
3.55E-7 |
1.41E-6 |
|
1 |
2.72E-7 |
1.59E-8 |
1.26E-7 |
5.37E-7 |
|
| PGA | 0.1 |
3.73E-4 |
1.55E-4 |
3.09E-4 |
5.75E-4 |
0.15 |
2.05E-4 |
8.32E-5 |
1.66E-4 |
3.31E-4 |
|
0.2 |
1.33E-4 |
5.13E-5 |
1.10E-4 |
2.19E-4 |
|
0.3 |
7.06E-5 |
2.40E-5 |
5.69E-5 |
1.18E-4 |
|
0.5 |
2.99E-5 |
8.51E-6 |
2.24E-5 |
5.50E-5 |
|
0.7 |
1.60E-5 |
3.98E-6 |
1.12E-5 |
2.95E-5 |
|
1 |
7.66E-6 |
1.62E-6 |
4.90E-6 |
1.38E-5 |
|
1.5 |
2.96E-6 |
4.68E-7 |
1.62E-6 |
5.25E-6 |
|
2 |
1.37E-6 |
1.78E-7 |
7.08E-7 |
2.46E-6 |
|
3 |
4.00E-7 |
3.63E-8 |
1.72E-7 |
6.61E-7 |
|
5 |
6.31E-8 |
3.47E-9 |
2.09E-8 |
1.02E-7 |
|
7 |
1.53E-8 |
5.75E-10 |
4.27E-9 |
2.32E-8 |
|
10 |
2.84E-9 |
6.76E-11 |
6.17E-10 |
4.27E-9 |
Table 8.2.6-1
Mean and Select Fractiles for Rock Hazard at Savannah: Digital Data for Figures 8.2-6a through 8.2-6c
| Frequency | Spectral Accel. (g) | Mean | 0.15 | 0.5 | 0.85 |
|---|---|---|---|---|---|
| 10 Hz | 0.1 |
1.71E-3 |
7.08E-4 |
1.51E-3 |
2.82E-3 |
0.15 |
1.13E-3 |
4.07E-4 |
9.66E-4 |
1.86E-3 |
|
0.2 |
7.99E-4 |
2.51E-4 |
6.61E-4 |
1.32E-3 |
|
0.3 |
4.46E-4 |
1.18E-4 |
3.31E-4 |
8.13E-4 |
|
0.5 |
1.81E-4 |
3.89E-5 |
1.18E-4 |
3.31E-4 |
|
0.7 |
9.06E-5 |
1.70E-5 |
5.13E-5 |
1.66E-4 |
|
1 |
4.08E-5 |
6.46E-6 |
2.09E-5 |
7.00E-5 |
|
1.5 |
1.53E-5 |
1.86E-6 |
6.92E-6 |
2.57E-5 |
|
2 |
7.23E-6 |
7.59E-7 |
3.02E-6 |
1.12E-5 |
|
3 |
2.30E-6 |
2.04E-7 |
9.33E-7 |
3.47E-6 |
|
5 |
4.44E-7 |
3.16E-8 |
1.66E-7 |
6.84E-7 |
|
7 |
1.31E-7 |
8.51E-9 |
4.79E-8 |
2.04E-7 |
|
10 |
3.17E-8 |
1.74E-9 |
1.12E-8 |
5.13E-8 |
|
| 1 Hz | 0.01 |
2.88E-3 |
1.32E-3 |
2.63E-3 |
4.57E-3 |
0.015 |
2.10E-3 |
8.41E-4 |
1.86E-3 |
3.47E-3 |
|
0.02 |
1.68E-3 |
5.75E-4 |
1.51E-3 |
2.82E-3 |
|
0.03 |
1.18E-3 |
3.31E-4 |
1.00E-3 |
2.00E-3 |
|
0.05 |
6.82E-4 |
1.26E-4 |
5.01E-4 |
1.27E-3 |
|
0.07 |
4.37E-4 |
5.89E-5 |
2.88E-4 |
8.41E-4 |
|
0.1 |
2.50E-4 |
2.40E-5 |
1.35E-4 |
5.01E-4 |
|
0.15 |
1.19E-4 |
7.94E-6 |
5.13E-5 |
2.34E-4 |
|
0.2 |
6.51E-5 |
3.24E-6 |
2.24E-5 |
1.26E-4 |
|
0.3 |
2.53E-5 |
9.02E-7 |
6.46E-6 |
4.47E-5 |
|
0.5 |
6.52E-6 |
1.55E-7 |
1.23E-6 |
9.44E-6 |
|
0.7 |
2.41E-6 |
4.17E-8 |
3.80E-7 |
3.02E-6 |
|
1 |
7.64E-7 |
9.77E-9 |
1.10E-7 |
8.13E-7 |
|
| PGA | 0.1 |
8.13E-4 |
2.34E-4 |
6.17E-4 |
1.41E-3 |
0.15 |
4.46E-4 |
1.02E-4 |
3.09E-4 |
8.13E-4 |
|
0.2 |
2.70E-4 |
5.50E-5 |
1.66E-4 |
5.01E-4 |
|
0.3 |
1.22E-4 |
1.95E-5 |
6.76E-5 |
2.19E-4 |
|
0.5 |
3.99E-5 |
4.90E-6 |
1.95E-5 |
7.00E-5 |
|
0.7 |
1.81E-5 |
1.86E-6 |
7.94E-6 |
2.95E-5 |
|
1 |
7.37E-6 |
6.61E-7 |
2.92E-6 |
1.25E-5 |
|
1.5 |
2.40E-6 |
1.72E-7 |
8.71E-7 |
3.98E-6 |
|
2 |
9.94E-7 |
6.10E-8 |
3.55E-7 |
1.62E-6 |
|
3 |
2.50E-7 |
1.20E-8 |
7.76E-8 |
3.80E-7 |
|
5 |
3.40E-8 |
1.04E-9 |
8.51E-9 |
5.13E-8 |
|
7 |
7.66E-9 |
1.66E-10 |
1.68E-9 |
1.08E-8 |
|
10 |
1.34E-9 |
1.82E-11 |
2.34E-10 |
1.86E-9 |
Table 8.2.7-1
Mean and Select Fractiles for Rock Hazard at Topeka: Digital Data for Figures 8.2-7a through 8.2-7c
| Frequency | Spectral Accel. (g) | Mean | 0.15 | 0.5 | 0.85 |
|---|---|---|---|---|---|
| 10 Hz | 0.1 |
4.11E-4 |
1.45E-4 |
2.88E-4 |
5.75E-4 |
0.15 |
2.13E-4 |
7.24E-5 |
1.55E-4 |
3.09E-4 |
|
0.2 |
1.32E-4 |
4.47E-5 |
1.02E-4 |
1.91E-4 |
|
0.3 |
6.67E-5 |
2.24E-5 |
5.13E-5 |
1.02E-4 |
|
0.5 |
2.81E-5 |
9.12E-6 |
2.24E-5 |
4.47E-5 |
|
0.7 |
1.56E-5 |
4.57E-6 |
1.29E-5 |
2.57E-5 |
|
1 |
8.08E-6 |
2.14E-6 |
6.24E-6 |
1.38E-5 |
|
1.5 |
3.55E-6 |
8.13E-7 |
2.63E-6 |
6.46E-6 |
|
2 |
1.85E-6 |
3.55E-7 |
1.32E-6 |
3.24E-6 |
|
3 |
6.66E-7 |
1.02E-7 |
4.37E-7 |
1.23E-6 |
|
5 |
1.49E-7 |
1.48E-8 |
8.32E-8 |
2.69E-7 |
|
7 |
4.84E-8 |
3.24E-9 |
2.48E-8 |
8.91E-8 |
|
10 |
1.29E-8 |
5.19E-10 |
5.62E-9 |
2.40E-8 |
|
| 1 Hz | 0.01 |
2.32E-3 |
6.17E-4 |
1.74E-3 |
4.12E-3 |
0.015 |
1.42E-3 |
2.69E-4 |
9.33E-4 |
2.63E-3 |
|
0.02 |
9.55E-4 |
1.50E-4 |
5.37E-4 |
1.86E-3 |
|
0.03 |
5.00E-4 |
5.89E-5 |
2.19E-4 |
9.02E-4 |
|
0.05 |
1.92E-4 |
1.59E-5 |
6.31E-5 |
2.69E-4 |
|
0.07 |
9.44E-5 |
6.68E-6 |
2.75E-5 |
1.10E-4 |
|
0.1 |
4.13E-5 |
2.63E-6 |
1.12E-5 |
4.47E-5 |
|
0.15 |
1.46E-5 |
8.13E-7 |
3.98E-6 |
1.59E-5 |
|
0.2 |
6.63E-6 |
3.09E-7 |
1.86E-6 |
7.94E-6 |
|
0.3 |
2.08E-6 |
6.76E-8 |
6.61E-7 |
3.02E-6 |
|
0.5 |
4.85E-7 |
6.68E-9 |
1.55E-7 |
8.71E-7 |
|
0.7 |
1.89E-7 |
1.37E-9 |
5.31E-8 |
3.67E-7 |
|
1 |
6.87E-8 |
2.19E-10 |
1.59E-8 |
1.35E-7 |
|
| PGA | 0.01 |
4.03E-3 |
1.51E-3 |
3.02E-3 |
6.46E-3 |
0.015 |
2.46E-3 |
8.71E-4 |
1.74E-3 |
4.27E-3 |
|
0.02 |
1.67E-3 |
5.37E-4 |
1.11E-3 |
2.82E-3 |
|
0.03 |
9.14E-4 |
2.88E-4 |
5.75E-4 |
1.51E-3 |
|
0.05 |
4.10E-4 |
1.18E-4 |
2.69E-4 |
6.17E-4 |
|
0.07 |
2.40E-4 |
6.76E-5 |
1.66E-4 |
3.55E-4 |
|
0.1 |
1.35E-4 |
3.89E-5 |
9.55E-5 |
2.04E-4 |
|
0.15 |
6.97E-5 |
2.09E-5 |
5.13E-5 |
1.10E-4 |
|
0.2 |
4.40E-5 |
1.29E-5 |
3.39E-5 |
7.24E-5 |
|
0.3 |
2.31E-5 |
6.24E-6 |
1.82E-5 |
3.89E-5 |
|
0.5 |
9.77E-6 |
2.14E-6 |
6.92E-6 |
1.76E-5 |
|
0.7 |
5.24E-6 |
9.33E-7 |
3.47E-6 |
9.77E-6 |
|
1 |
2.51E-6 |
3.43E-7 |
1.41E-6 |
4.57E-6 |
Figure 8.1-1
Map showing the study area and seven test sites for the CEUS-SSC Project

Figure 8.1-2
Mean VS profile for shallow soil site
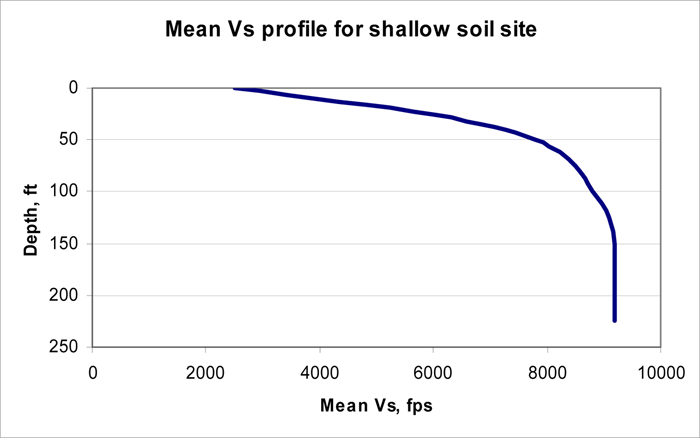
Figure 8.1-3
Mean VS profile for deep soil site

Figure 8.1-4
Mean amplification factors for shallow soil site
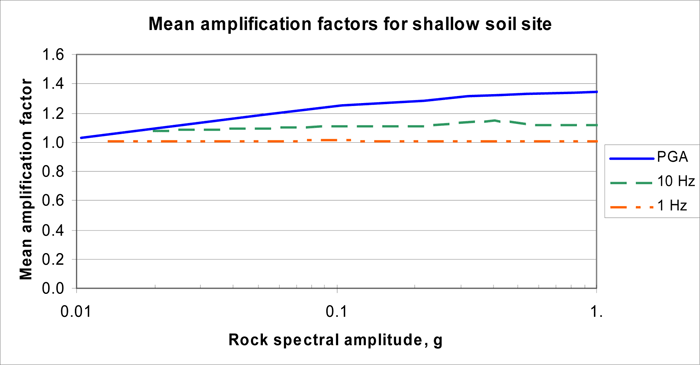
Figure 8.1-5
Mean amplification factors for deep soil site
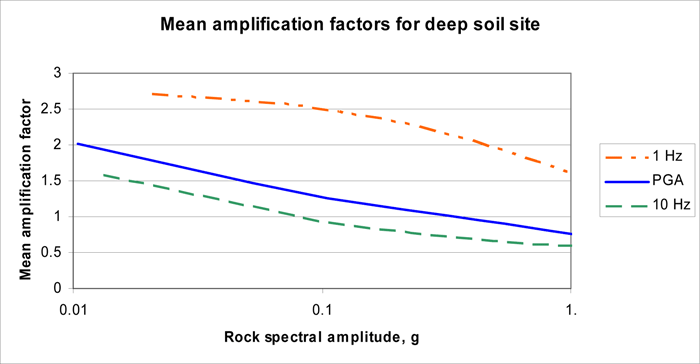
Figure 8.2-1a
Central Illinois 10 Hz rock hazard: mean and fractile total hazard
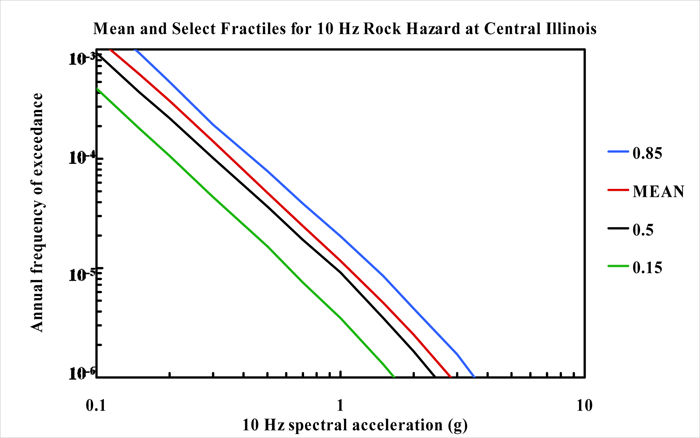
Figure 8.2-1b
Central Illinois 1 Hz rock hazard: mean and fractile total hazard
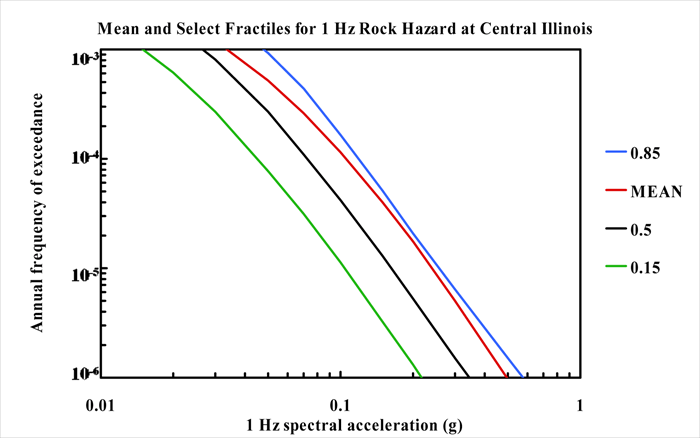
Figure 8.2-1c
Central Illinois PGA rock hazard: mean and fractile total hazard

Figure 8.2-1d
Central Illinois 10 Hz rock hazard: total and contribution by RLME and background

Figure 8.2-1e
Central Illinois 1 Hz rock hazard: total and contribution by RLME and background
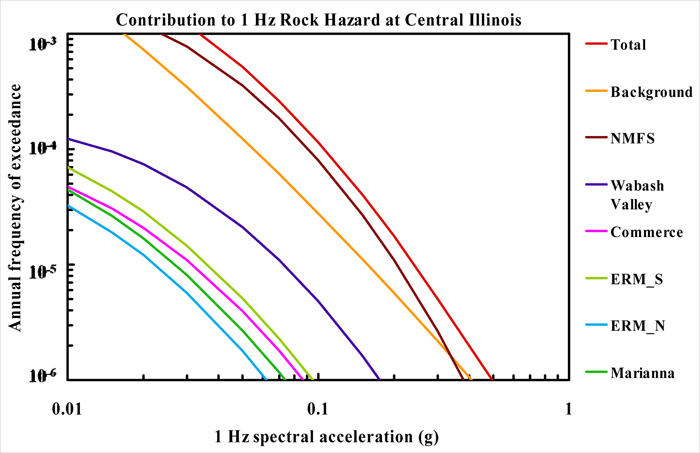
Figure 8.2-1f
Central Illinois PGA rock hazard: total and contribution by RLME and background

Figure 8.2-1g
Central Illinois 10 Hz rock hazard: contribution by background source
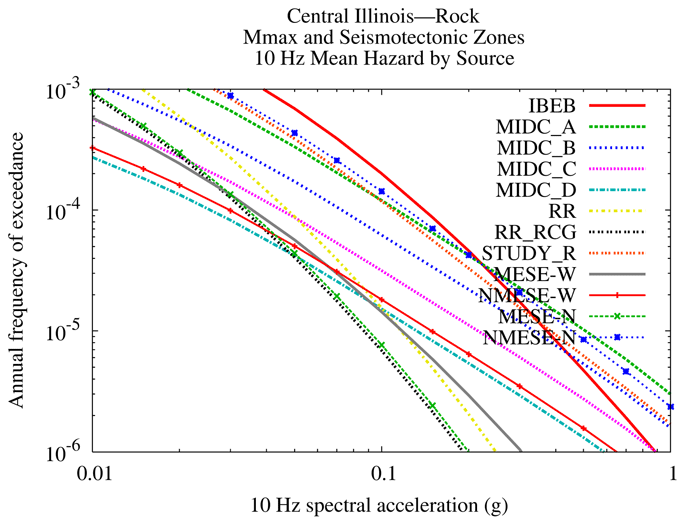
Figure 8.2-1h
Central Illinois 1 Hz rock hazard: contribution by background source

Figure 8.2-1i
Central Illinois PGA rock hazard: contribution by background source
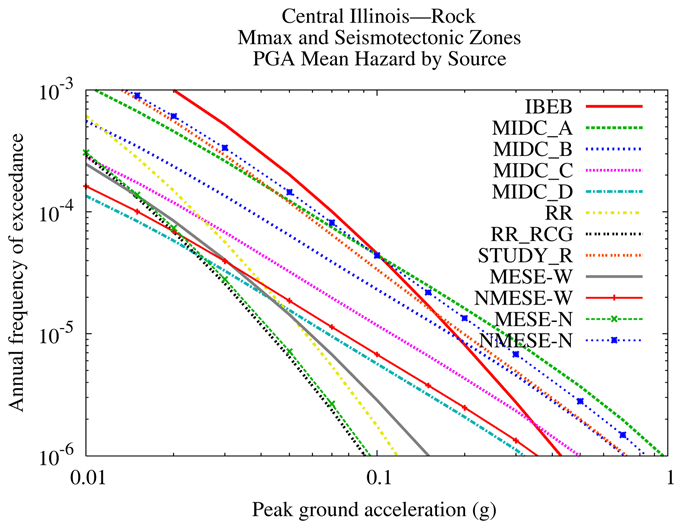
Figure 8.2-1j
Central Illinois 10 Hz rock hazard: comparison of three source models.
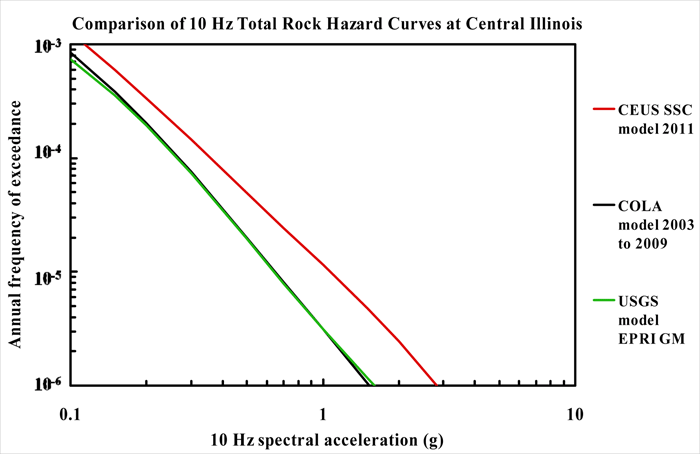
Figure 8.2-1k
Central Illinois 1 Hz rock hazard: comparison of three source models

Figure 8.2-1l
Central Illinois PGA rock hazard: comparison of three source models

Figure 8.2-1m
Central Illinois 10 Hz shallow soil hazard: total and total and contribution by RLME and background

Figure 8.2-1n
Central Illinois 1 Hz shallow soil hazard: total and contribution by RLME and background

Figure 8.2-1o
Central Illinois PGA shallow soil hazard: total and contribution by RLME and background

Figure 8.2-1p
Central Illinois 10 Hz deep soil hazard: total and contribution by RLME and background

Figure 8.2-1q
Central Illinois 1 Hz deep soil hazard: total and contribution by RLME and background
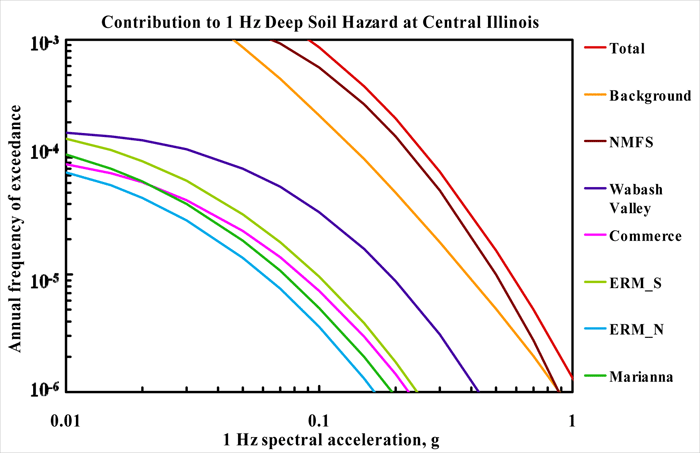
Figure 8.2-1r
Central Illinois PGA deep soil hazard: total and contribution by RLME and background

Figure 8.2-1s
Central Illinois 10 Hz hazard: comparison of three site conditions
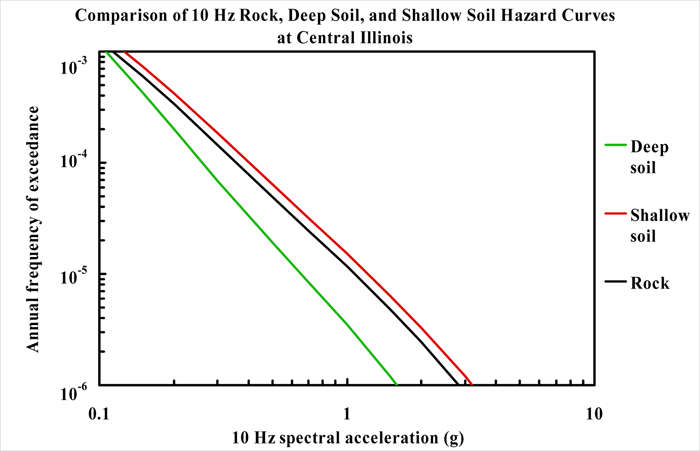
Figure 8.2-1t
Central Illinois 1 Hz hazard: comparison of three site conditions
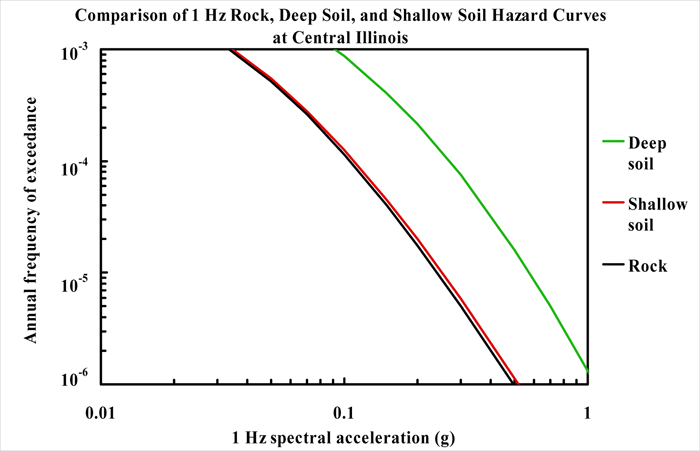
Figure 8.2-1u
Central Illinois PGA hazard: comparison of three site conditions

Figure 8.2-1v
Central Illinois 10 Hz rock hazard: sensitivity to seismotectonic vs. Mmax zones
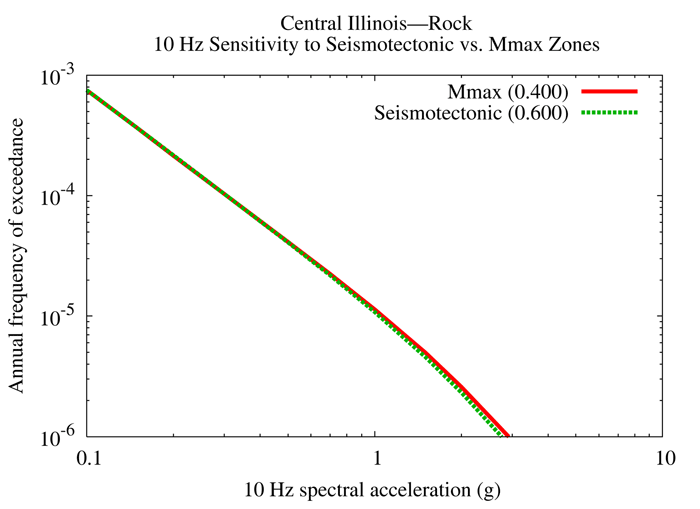
Figure 8.2-1w
Central Illinois 1 Hz rock hazard: sensitivity to seismotectonic vs. Mmax zones

Figure 8.2-1x
Central Illinois 10 Hz rock hazard: sensitivity to Mmax for source IBEB
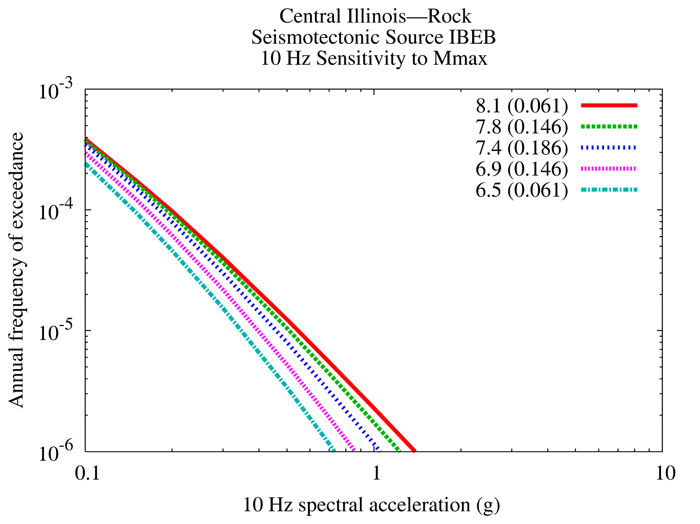
Figure 8.2-1y
Central Illinois 1 Hz rock hazard: sensitivity to Mmax for source IBEB

Figure 8.2-1z
Central Illinois 10 Hz rock hazard: sensitivity to smoothing options

Figure 8.2-1aa
Central Illinois 1 Hz rock hazard: sensitivity to smoothing options
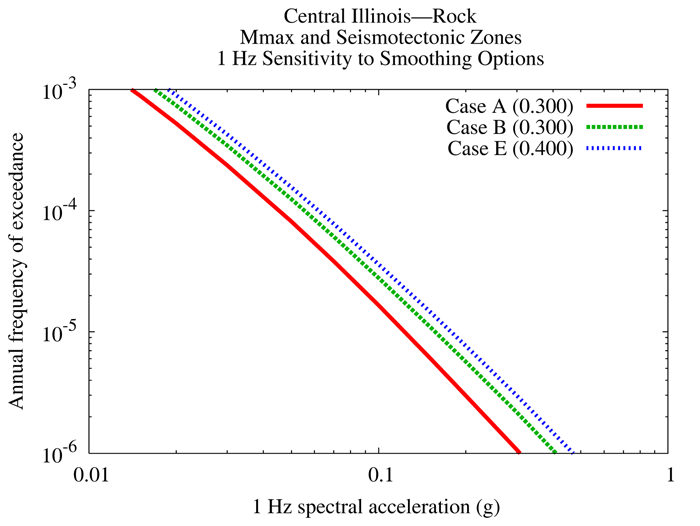
Figure 8.2-1bb
Central Illinois 10 Hz rock hazard: sensitivity to eight realizations for source IBEB, Case A

Figure 8.2-1cc
Central Illinois 10 Hz rock hazard: sensitivity to eight realizations for source IBEB, Case B

Figure 8.2-1dd
Central Illinois 10 Hz rock hazard: sensitivity to eight realizations for source IBEB, Case E

Figure 8.2-1ee
Central Illinois 1 Hz rock hazard: sensitivity to eight realizations for source IBEB, Case A
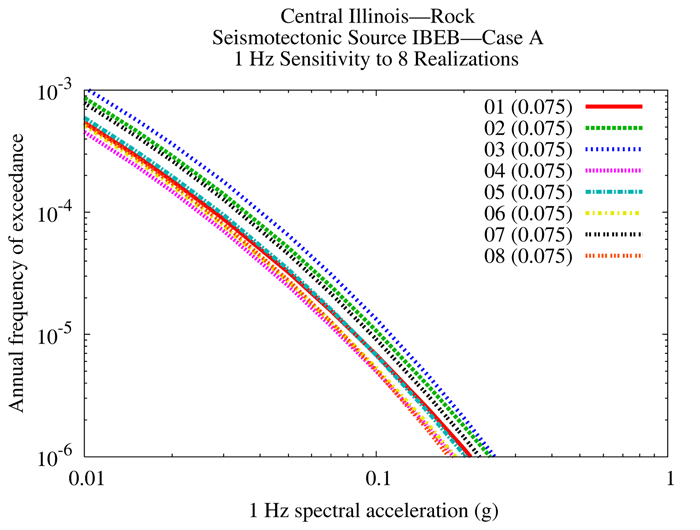
Figure 8.2-1ff
Central Illinois 1 Hz rock hazard: sensitivity to eight realizations for source IBEB, Case B

Figure 8.2-1gg
Central Illinois 1 Hz rock hazard: sensitivity to eight realizations for source IBEB, Case E

Figure 8.2-2a
Chattanooga 10 Hz rock hazard: mean and fractile total hazard
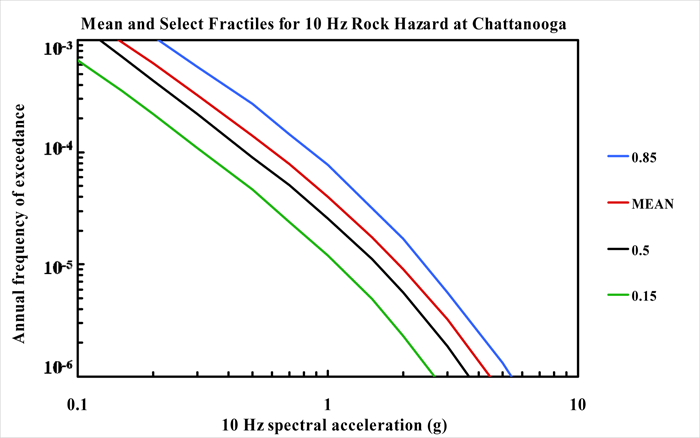
Figure 8.2-2b
Chattanooga 1 Hz rock hazard: mean and fractile total hazard
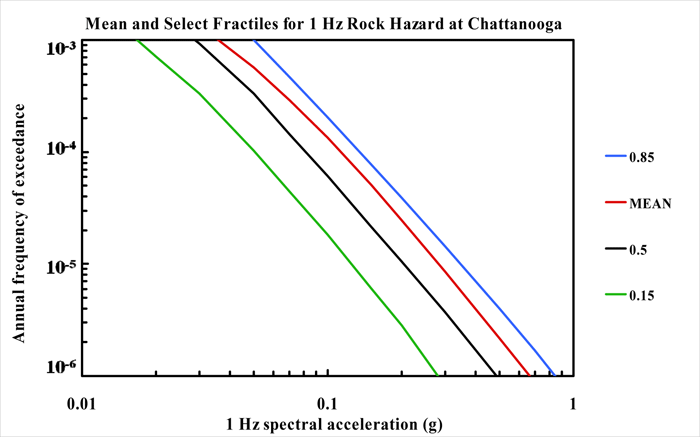
Figure 8.2-2c
Chattanooga PGA rock hazard: mean and fractile total hazard
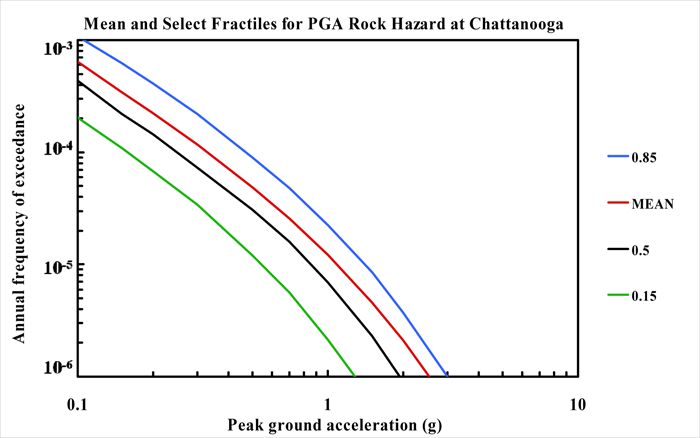
Figure 8.2-2d
Chattanooga 10 Hz rock hazard: total and contribution by RLME and background

Figure 8.2-2e
Chattanooga 1 Hz rock hazard: total and contribution by RLME and background

Figure 8.2-2f
Chattanooga PGA rock hazard: total and contribution by RLME and background

Figure 8.2-2g
Chattanooga 10 Hz rock hazard: contribution by background source
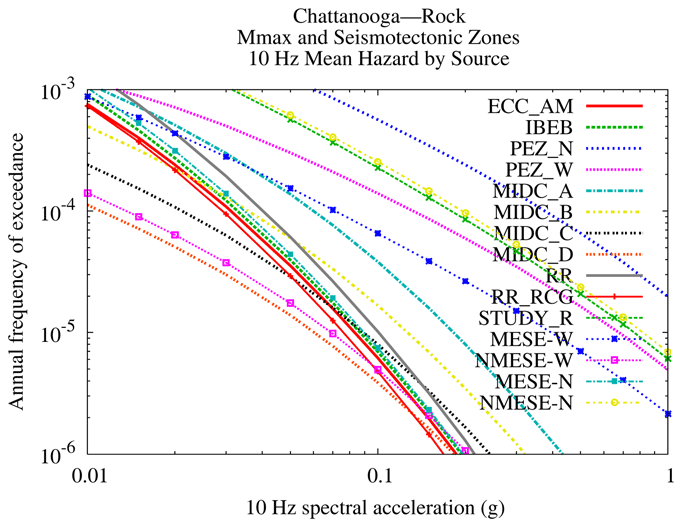
Figure 8.2-2h
Chattanooga 1 Hz rock hazard: contribution by background source
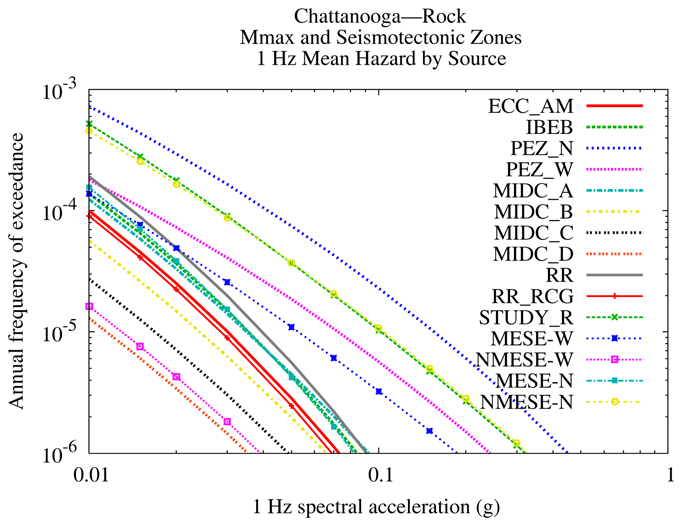
Figure 8.2-2i
Chattanooga PGA rock hazard: contribution by background source

Figure 8.2-2j
Chattanooga 10 Hz rock hazard: comparison of three source models
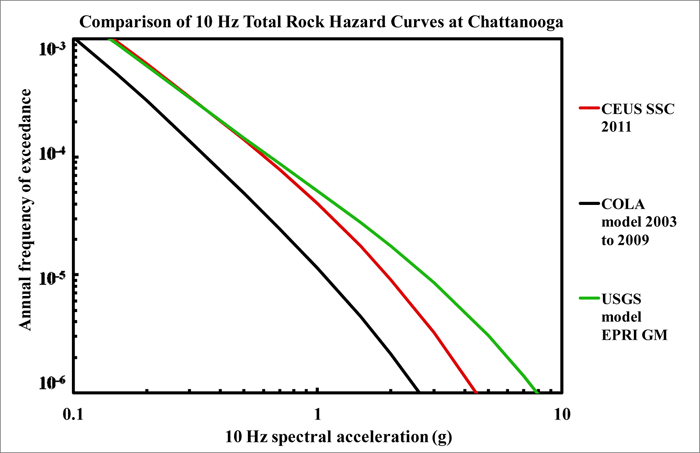
Figure 8.2-2k
Chattanooga is 1 Hz rock hazard: comparison of three source models
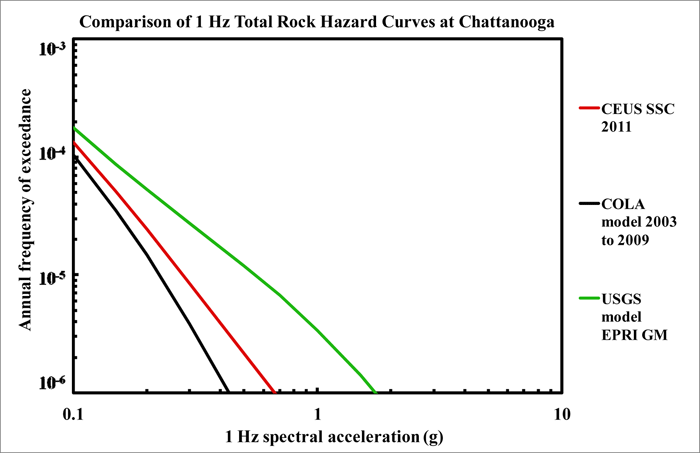
Figure 8.2-2l
Chattanooga PGA rock hazard: comparison of three source models

Figure 8.2-2m
Chattanooga 10 Hz shallow soil hazard: total and contribution by RLME and background
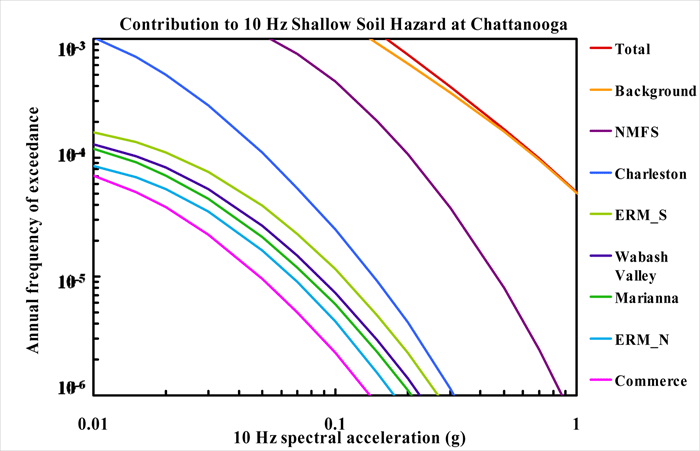
Figure 8.2-2n
Chattanooga 1 Hz shallow soil hazard: total and contribution by RLME and background
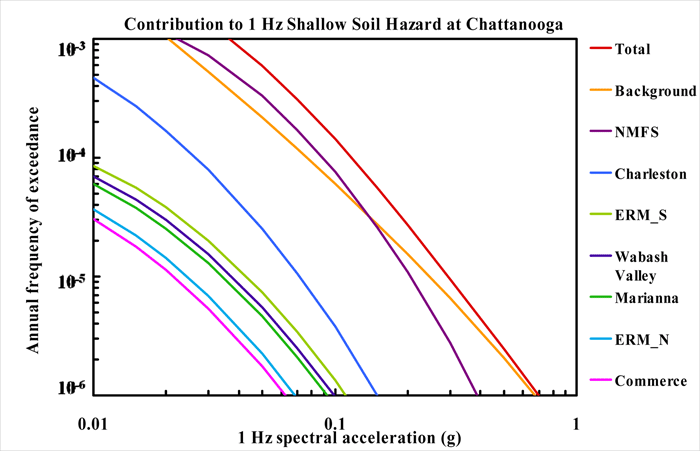
Figure 8.2-2o
Chattanooga PGA shallow soil hazard: total and contribution by RLME and background
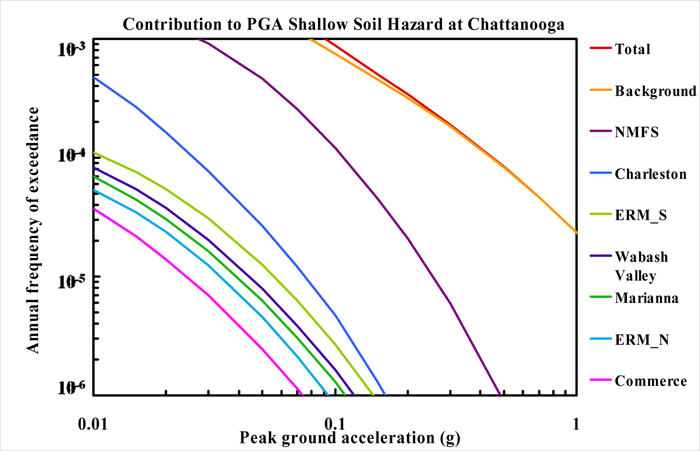
Figure 8.2-2p
Chattanooga 10 Hz deep soil hazard: total and contribution by RLME and background

Figure 8.2-2q
Chattanooga 1 Hz deep soil hazard: total and contribution by RLME and background

Figure 8.2-2r
Chattanooga PGA deep soil hazard: total and contribution by RLME and background
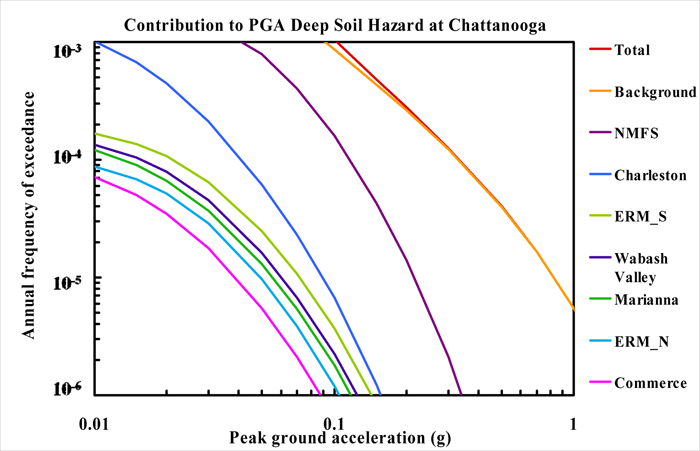
Figure 8.2-2s
Chattanooga 10 Hz hazard: comparison of three site conditions
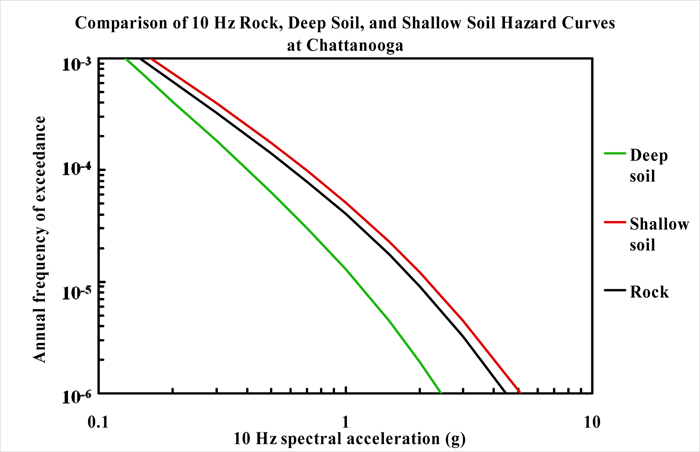
Figure 8.2-2t
Chattanooga 1 Hz hazard: comparison of three site conditions
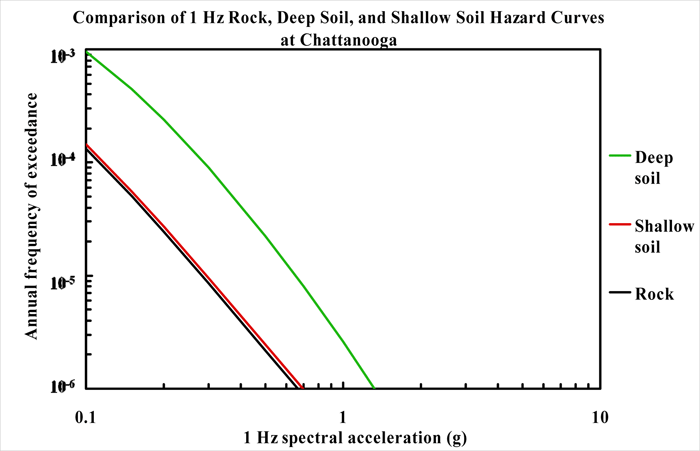
Figure 8.2-2u
Chattanooga PGA hazard: comparison of three site conditions

Figure 8.2-2v
Chattanooga 10 Hz rock hazard: sensitivity to seismotectonic vs. Mmax zones

Figure 8.2-2w
Chattanooga 1 Hz rock hazard: sensitivity to seismotectonic vs. Mmax zones
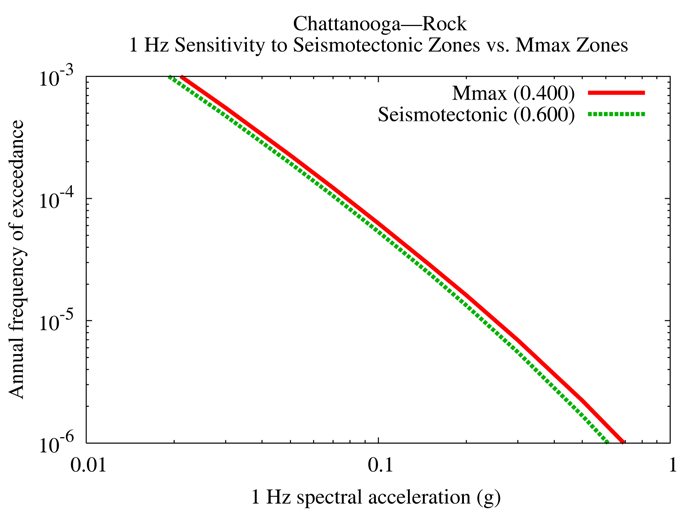
Figure 8.2-2x
Chattanooga 10 Hz rock hazard: sensitivity to Mmax for source PEZ-N

Figure 8.2-2y
Chattanooga 1 Hz rock hazard: sensitivity to Mmax for source PEZ-N
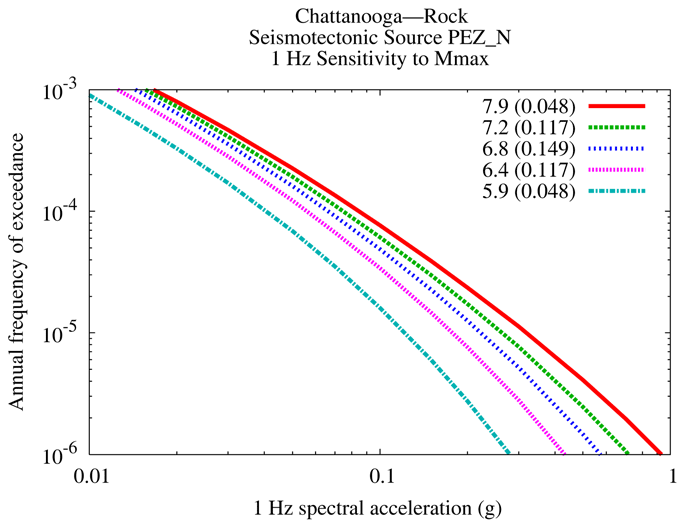
Figure 8.2-2z
Chattanooga 10 Hz rock hazard: sensitivity to smoothing options
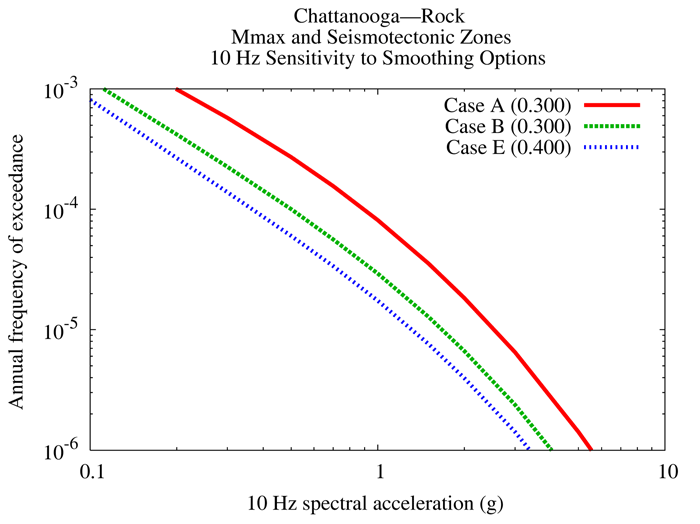
Figure 8.2-2aa
Chattanooga 1 Hz rock hazard: sensitivity to smoothing options
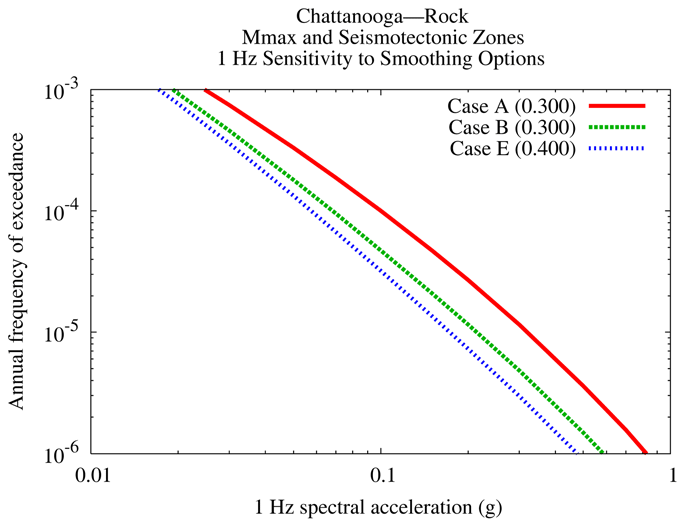
Figure 8.2-2bb
Chattanooga 10 Hz rock hazard: sensitivity to eight realizations for source PEZ-N, Case A
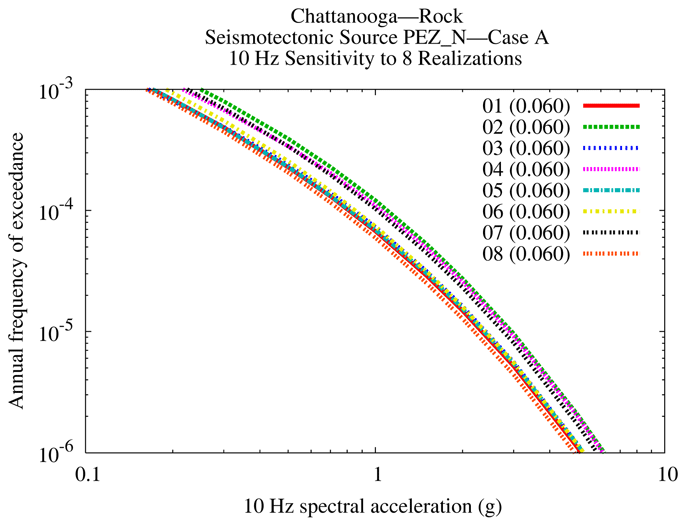
Figure 8.2-2cc
Chattanooga 10 Hz rock hazard: sensitivity to eight realizations for source PEZ-N, Case B
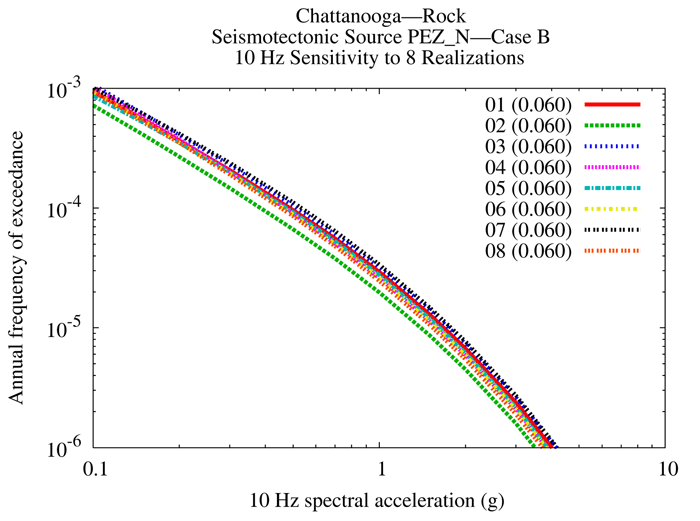
Figure 8.2-2dd
Chattanooga 10 Hz rock hazard: sensitivity to eight realizations for source PEZ-N, Case E
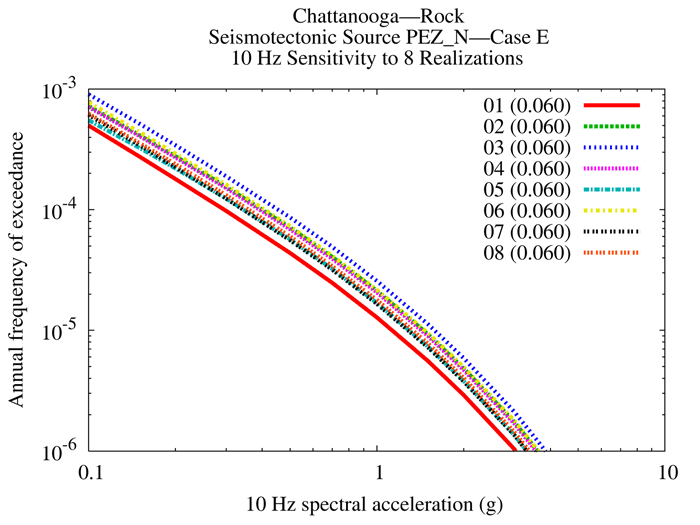
Figure 8.2-2ee
Chattanooga 1 Hz rock hazard: sensitivity to eight realizations for source PEZ-N, Case A
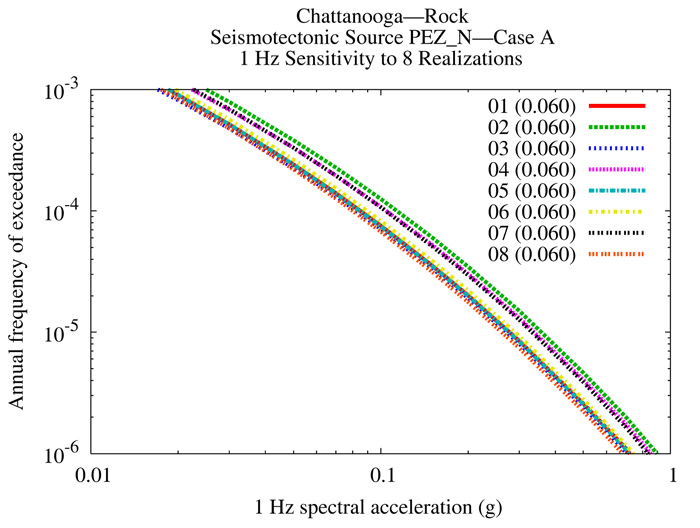
Figure 8.2-2ff
Chattanooga 1 Hz rock hazard: sensitivity to eight realizations for source PEZ-N, Case B

Figure 8.2-2gg
Chattanooga 1 Hz rock hazard: sensitivity to eight realizations for source PEZ-N, Case E

Figure 8.2-3a
Houston 10 Hz rock hazard: mean and fractile total hazard
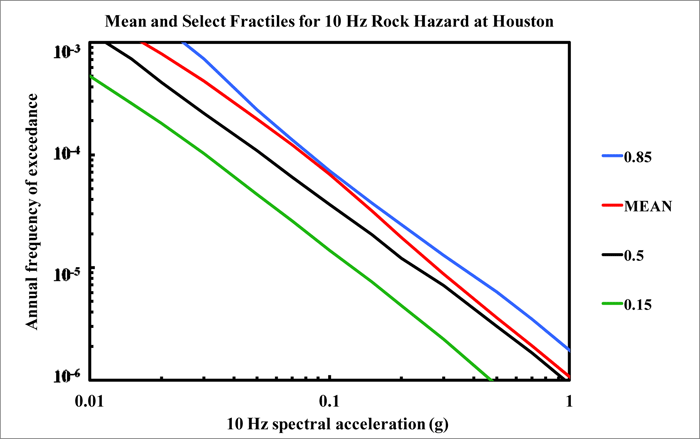
Figure 8.2-3b
Houston 1 Hz rock hazard: mean and fractile total hazard
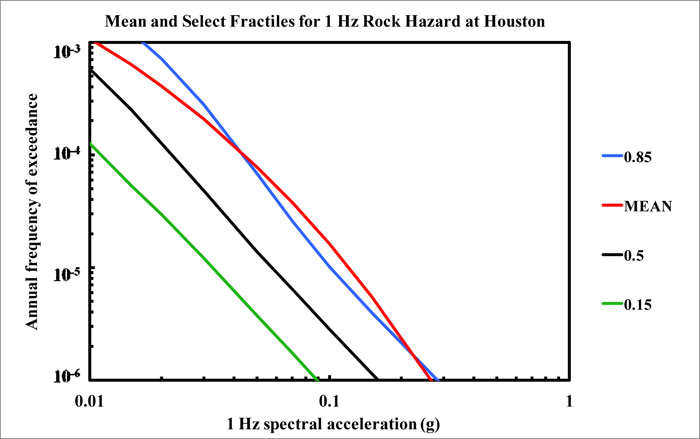
Figure 8.2-3c
Houston PGA rock hazard: mean and fractile total hazard

Figure 8.2-3d
Houston 10 Hz rock hazard: total and contribution by RLME and background
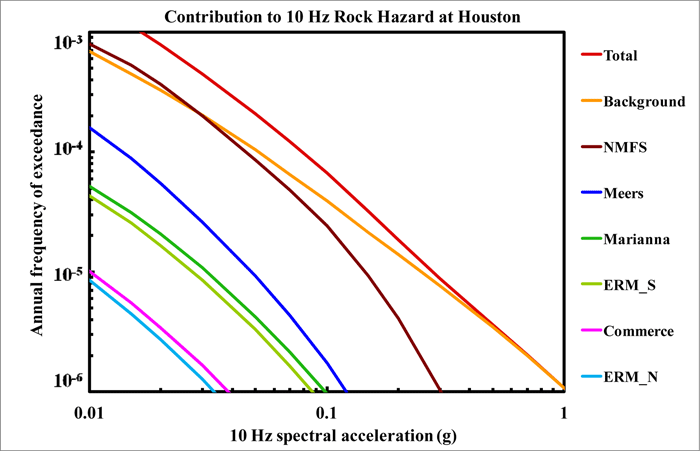
Figure 8.2-3e
Houston 1 Hz rock hazard: total and contribution by RLME and background
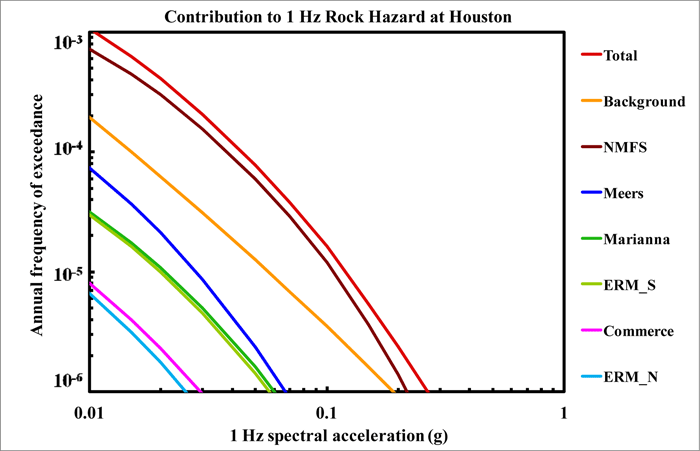
Figure 8.2-3f
Houston PGA rock hazard: total and contribution by RLME and background
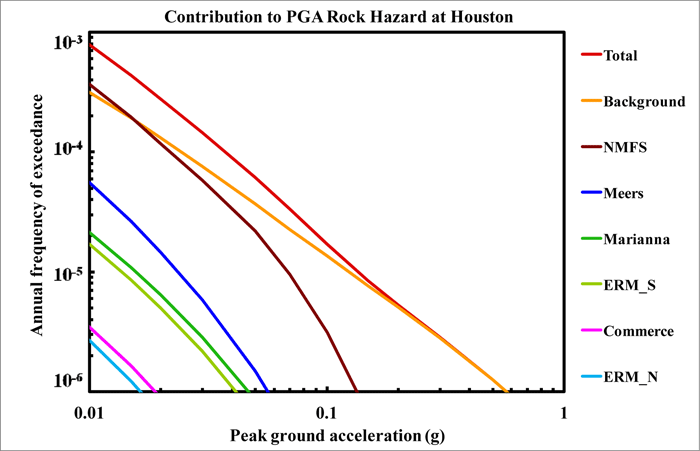
Figure 8.2-3g
Houston 10 Hz rock hazard: contribution by background source
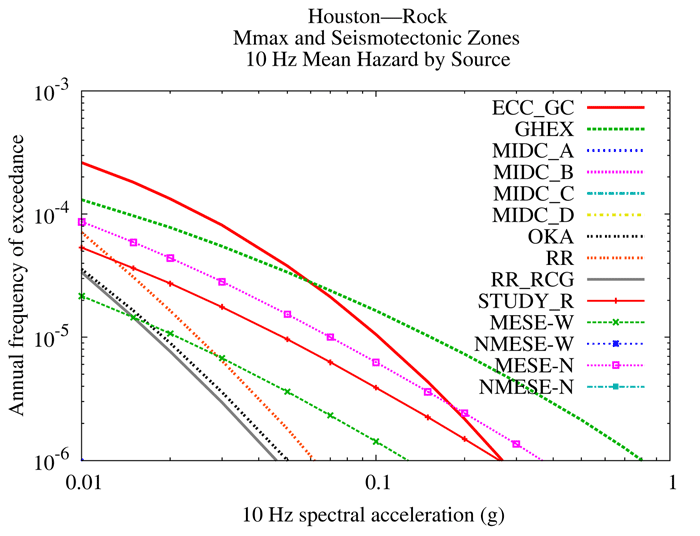
Figure 8.2-3h
Houston 1 Hz rock hazard: contribution by background source

Figure 8.2-3i
Houston PGA rock hazard: contribution by background source
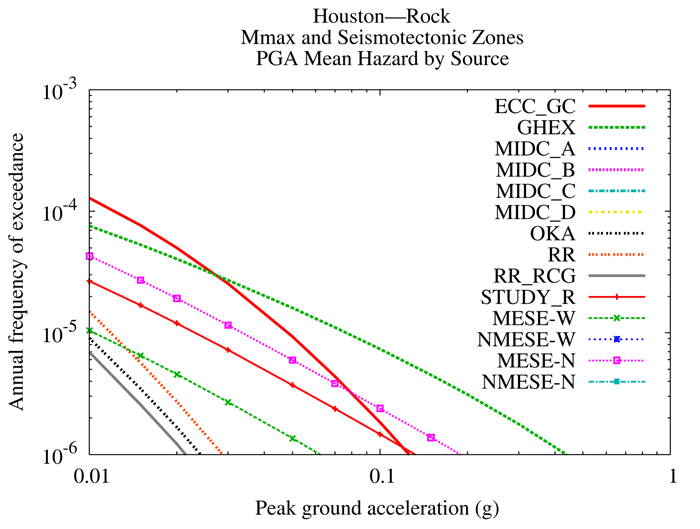
Figure 8.2-3j
Houston 10 Hz rock hazard: comparison of three source models

Figure 8.2-3k
Houston is 1 Hz rock hazard: comparison of three source models
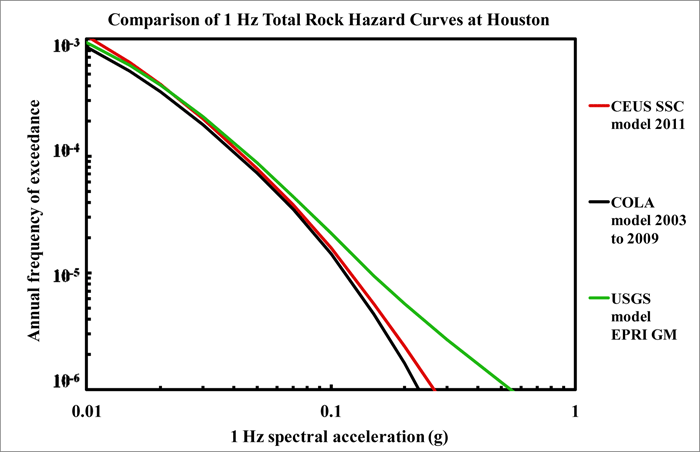
Figure 8.2-3l
Houston PGA rock hazard: comparison of three source models
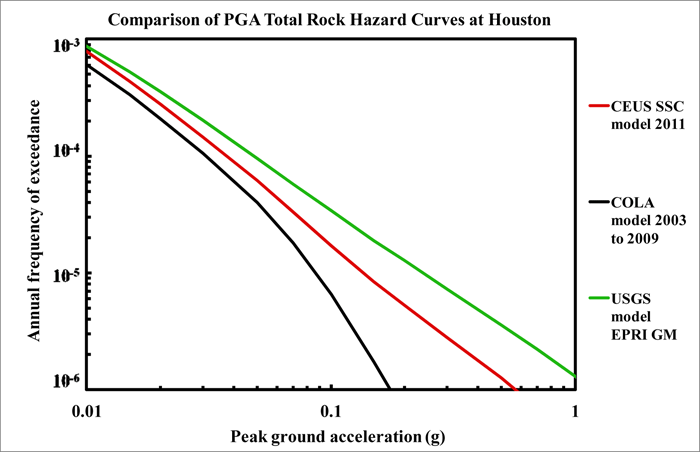
Figure 8.2-3m
Houston 10 Hz shallow soil hazard: total and contribution by RLME and background
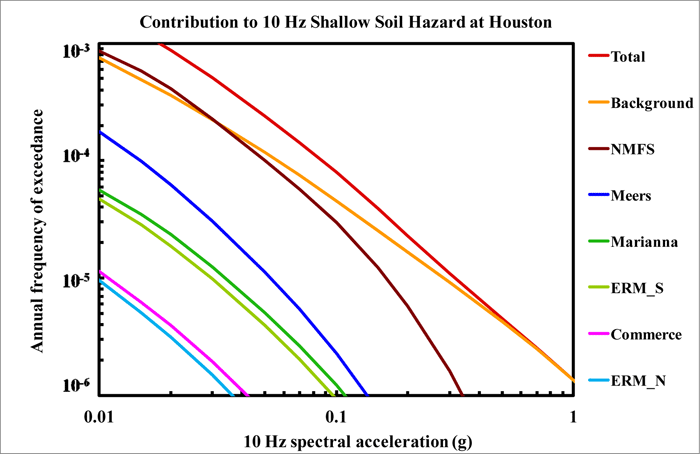
Figure 8.2-3n
Houston 1 Hz shallow soil hazard: total and contribution by RLME and background
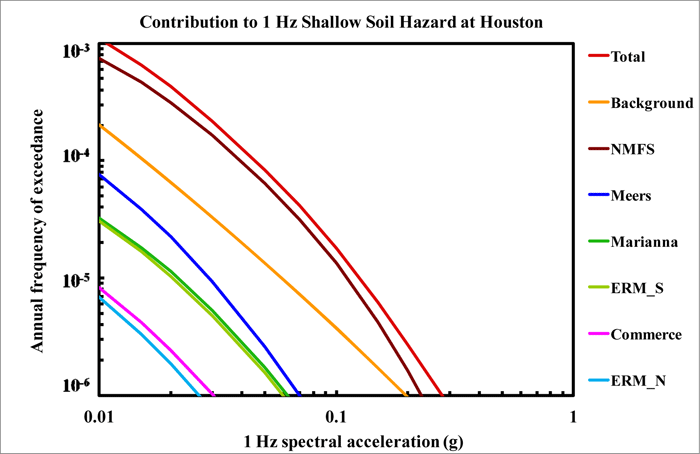
Figure 8.2-3o
Houston PGA shallow soil hazard: total and contribution by RLME and background
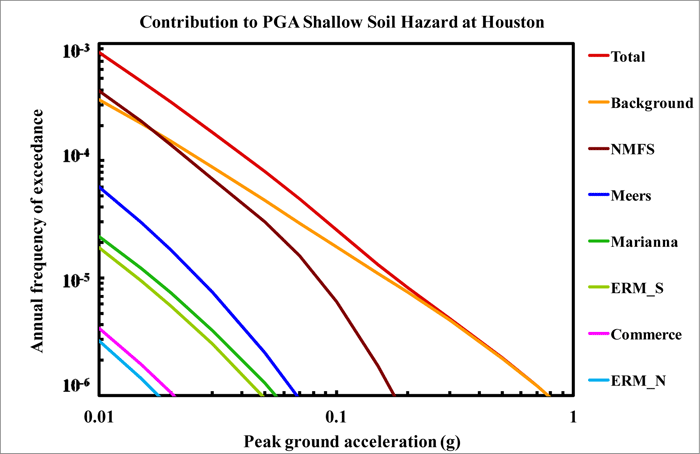
Figure 8.2-3p
Houston 10 Hz deep soil hazard: total and contribution by RLME and background
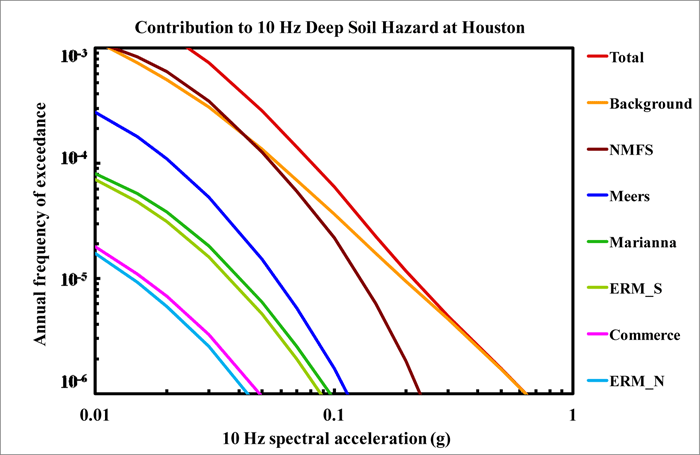
Figure 8.2-3q
Houston 1 Hz deep soil hazard: total and contribution by RLME and background
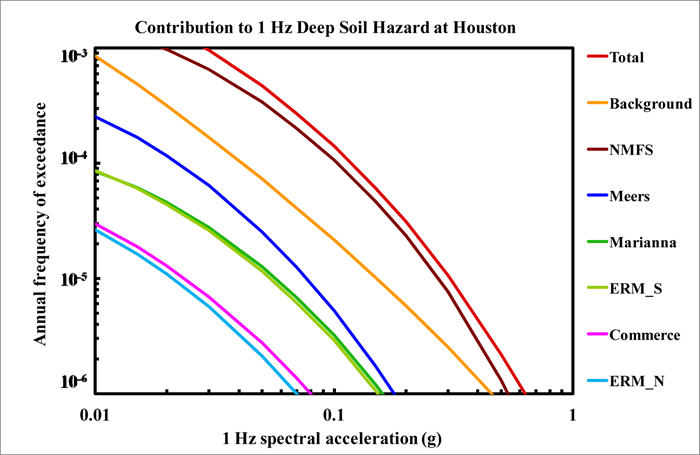
Figure 8.2-3r
Houston PGA deep soil hazard: total and contribution by RLME and background
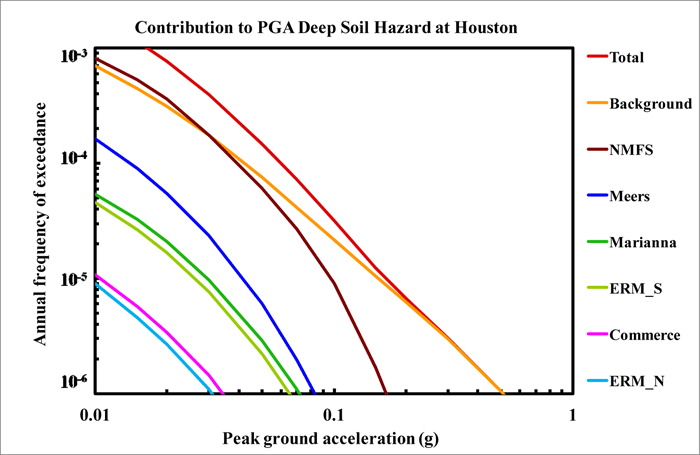
Figure 8.2-3s
Houston 10 Hz hazard: comparison of three site conditions
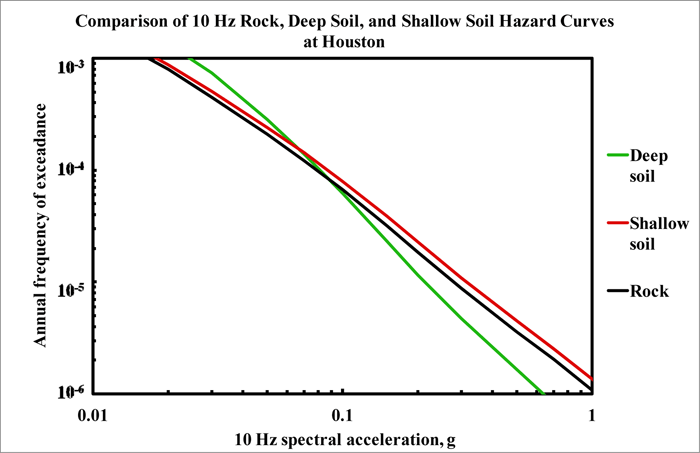
Figure 8.2-3t
Houston 1 Hz hazard: comparison of three site conditions
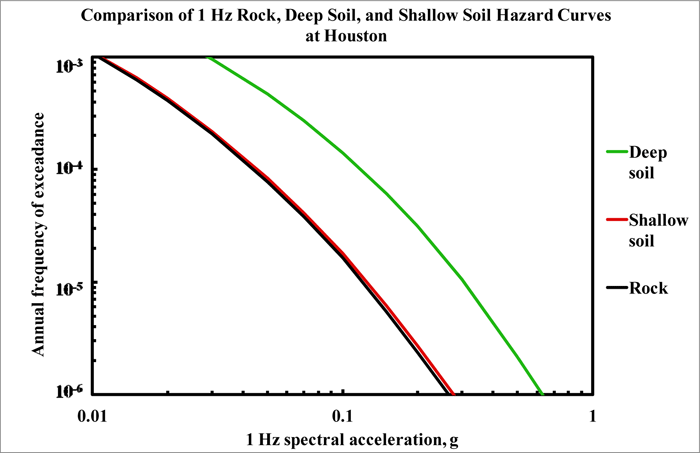
Figure 8.2-3u
Houston PGA hazard: comparison of three site conditions

Figure 8.2-3v
Houston 10 Hz rock hazard: sensitivity to seismotectonic vs. Mmax zones
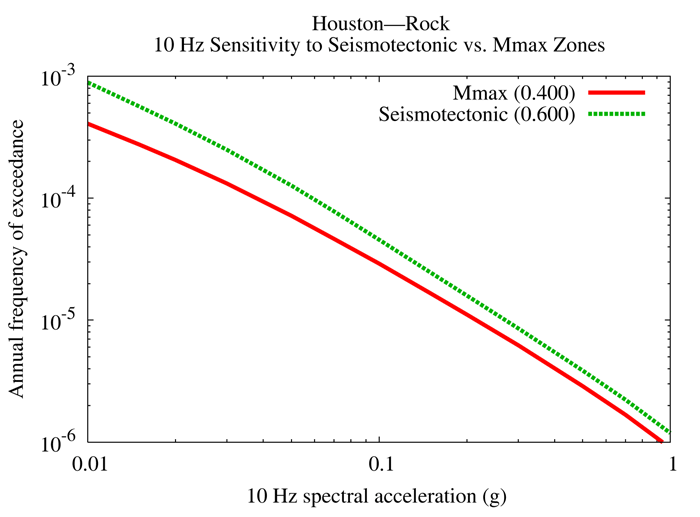
Figure 8.2-3w
Houston 1 Hz rock hazard: sensitivity to seismotectonic vs. Mmax zones

Figure 8.2-3x
Houston 10 Hz rock hazard: sensitivity to Mmax for source GHEX
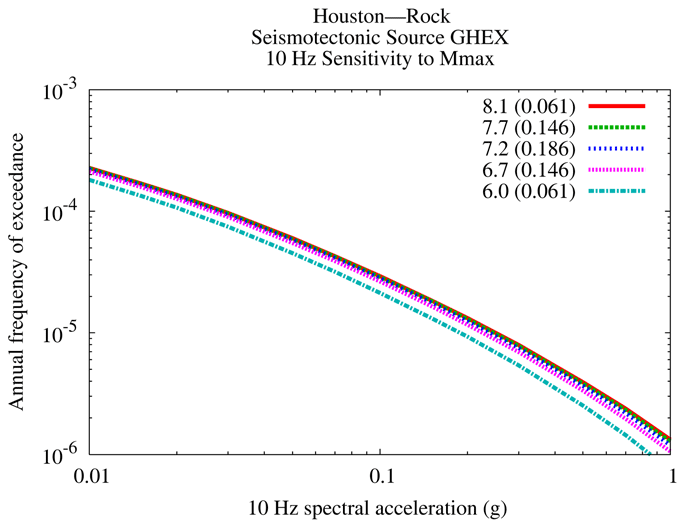
Figure 8.2-3y
Houston 1 Hz rock hazard: sensitivity to Mmax for source GHEX

Figure 8.2-3z
Houston 10 Hz rock hazard: sensitivity to smoothing options

Figure 8.2-3aa
Houston 1 Hz rock hazard: sensitivity to smoothing options
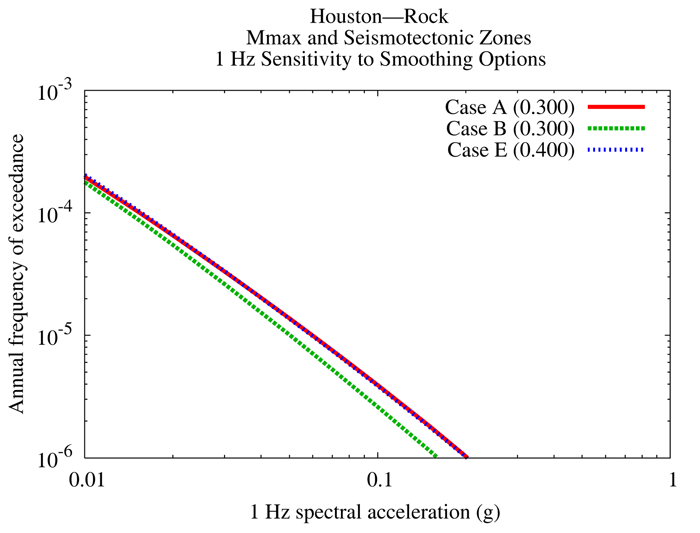
Figure 8.2-3bb
Houston 10 Hz rock hazard: sensitivity to eight realizations for source GHEX, Case A
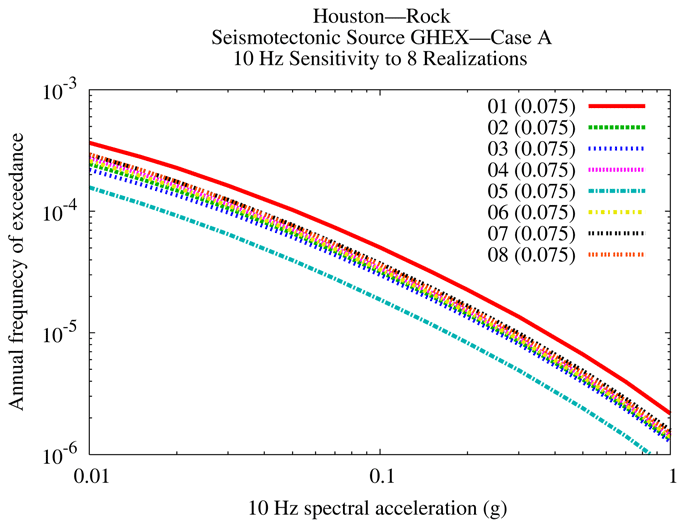
Figure 8.2-3cc
Houston 10 Hz rock hazard: sensitivity to eight realizations for source GHEX, Case B

Figure 8.2-3dd
Houston 10 Hz rock hazard: sensitivity to eight realizations for source GHEX, Case E
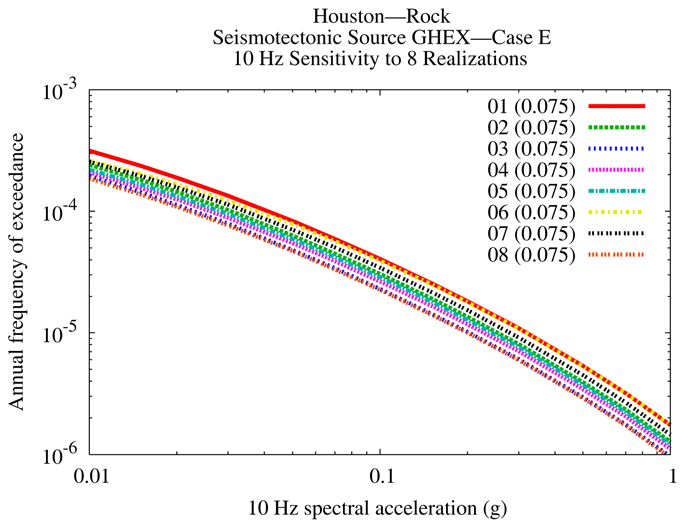
Figure 8.2-3ee
Houston 1 Hz rock hazard: sensitivity to eight realizations for source GHEX, Case A

Figure 8.2-3ff
Houston 1 Hz rock hazard: sensitivity to eight realizations for source GHEX, Case B
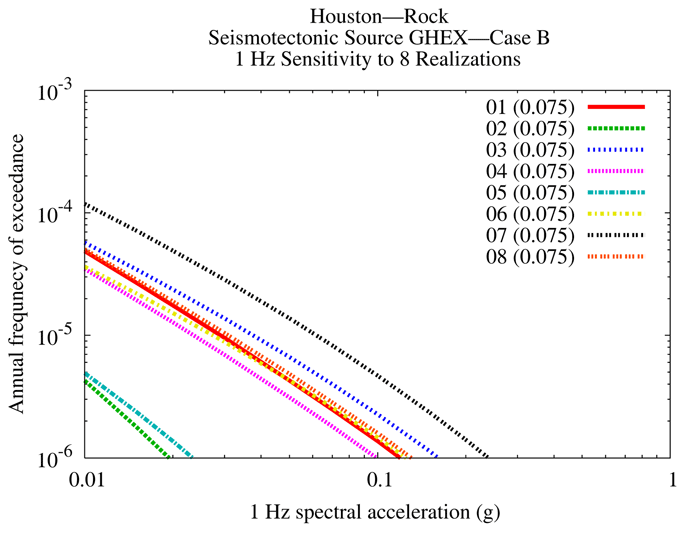
Figure 8.2-3gg
Houston 1 Hz rock hazard: sensitivity to eight realizations for source GHEX, Case E
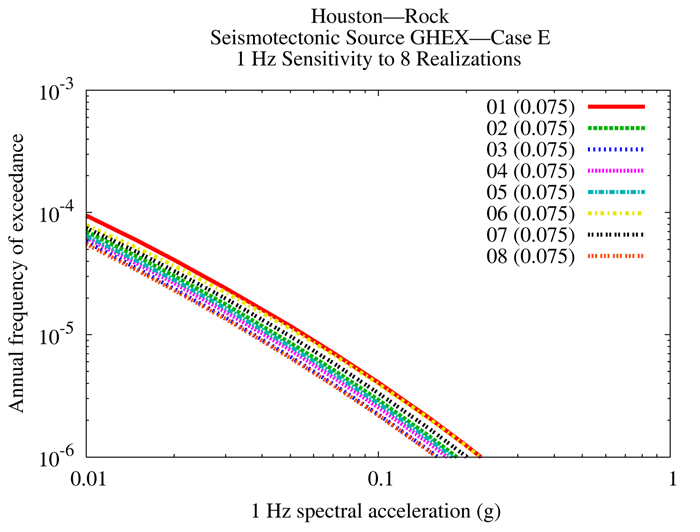
Figure 8.2-4a
Jackson 10 Hz rock hazard: mean and fractile total hazard
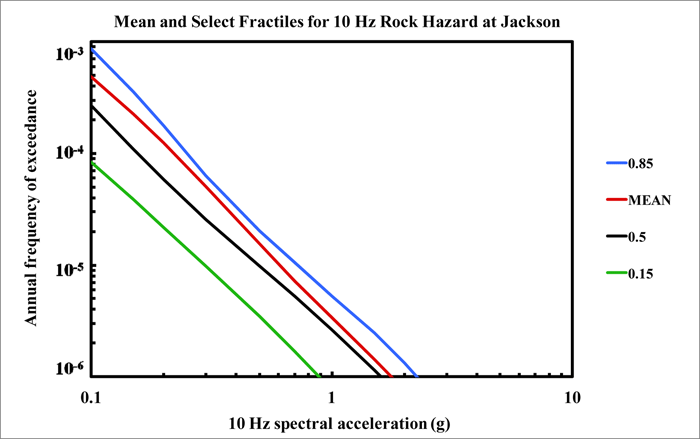
Figure 8.2-4b
Jackson 1 Hz rock hazard: mean and fractile total hazard

Figure 8.2-4c
Jackson PGA rock hazard: mean and fractile total hazard

Figure 8.2-4d
Jackson 10 Hz rock hazard: total and contribution by RLME and background

Figure 8.2-4e
Jackson 1 Hz rock hazard: total and contribution by RLME and background
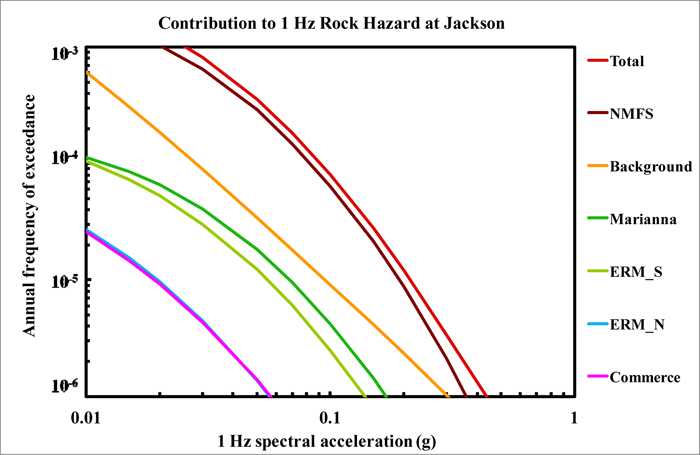
Figure 8.2-4f
Jackson PGA rock hazard: total and contribution by RLME and background
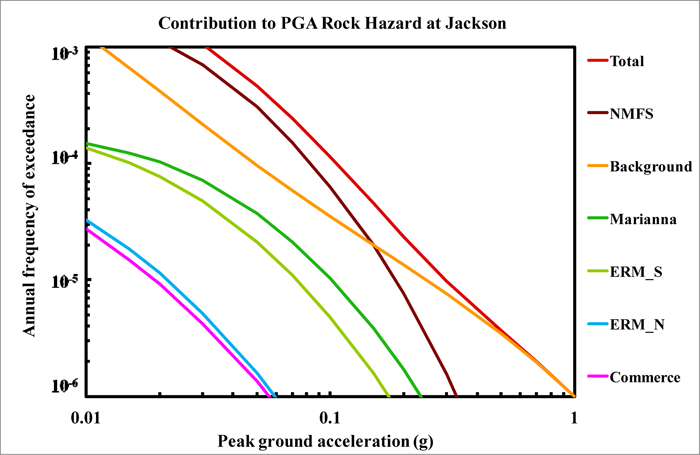
Figure 8.2-4g
Jackson 10 Hz rock hazard: contribution by background source

Figure 8.2-4h
Jackson 1 Hz rock hazard: contribution by background source

Figure 8.2-4i
Jackson PGA rock hazard: contribution by background source

Figure 8.2-4j
Jackson 10 Hz rock hazard: comparison of three source models
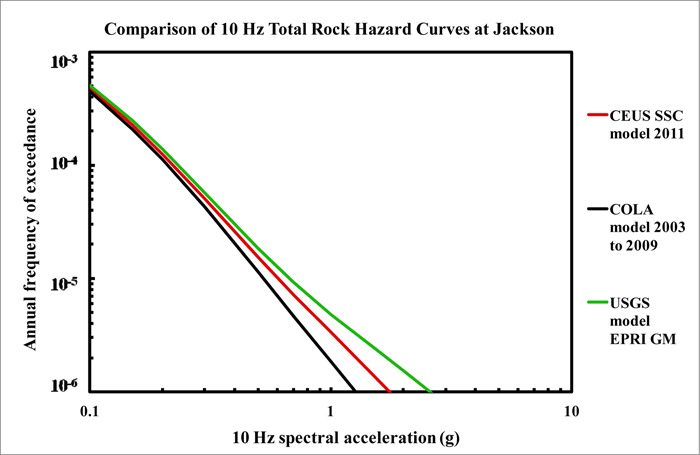
Figure 8.2-4k
Jackson is 1 Hz rock hazard: comparison of three source models

Figure 8.2-4l
Jackson PGA rock hazard: comparison of three source models
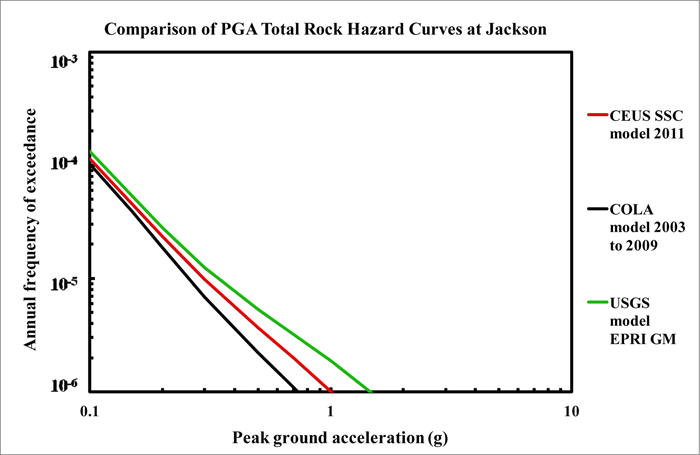
Figure 8.2-4m
Jackson 10 Hz shallow soil hazard: total and contribution by RLME and background

Figure 8.2-4n
Jackson 1 Hz shallow soil hazard: total and contribution by RLME and background

Figure 8.2-4o
Jackson PGA shallow soil hazard: total and contribution by RLME and background

Figure 8.2-4p
Jackson 10 Hz deep soil hazard: total and contribution by RLME and background

Figure 8.2-4q
Jackson 1 Hz deep soil hazard: total and contribution by RLME and background

Figure 8.2-4r
Jackson PGA deep soil hazard: total and contribution by RLME and background

Figure 8.2-4s
Jackson 10 Hz hazard: comparison of three site conditions
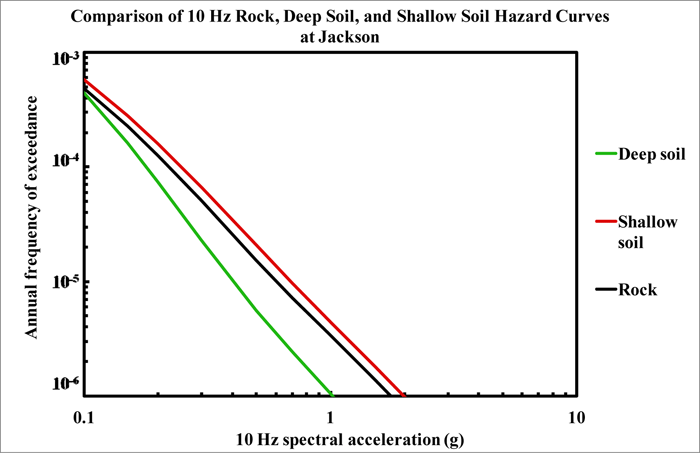
Figure 8.2-4t
Jackson 1 Hz hazard: comparison of three site conditions

Figure 8.2-4u
Jackson PGA hazard: comparison of three site conditions
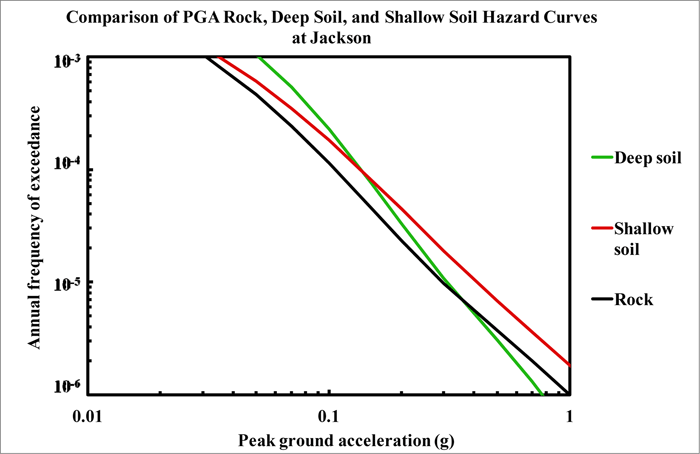
Figure 8.2-4v
Jackson 10 Hz rock hazard: sensitivity to seismotectonic vs. Mmax zones

Figure 8.2-4w
Jackson 1 Hz rock hazard: sensitivity to seismotectonic vs. Mmax zones

Figure 8.2-4x
Jackson 10 Hz rock hazard: sensitivity to Mmax for source ECC-GC

Figure 8.2-4y
Jackson 1 Hz rock hazard: sensitivity to Mmax for source ECC-GC
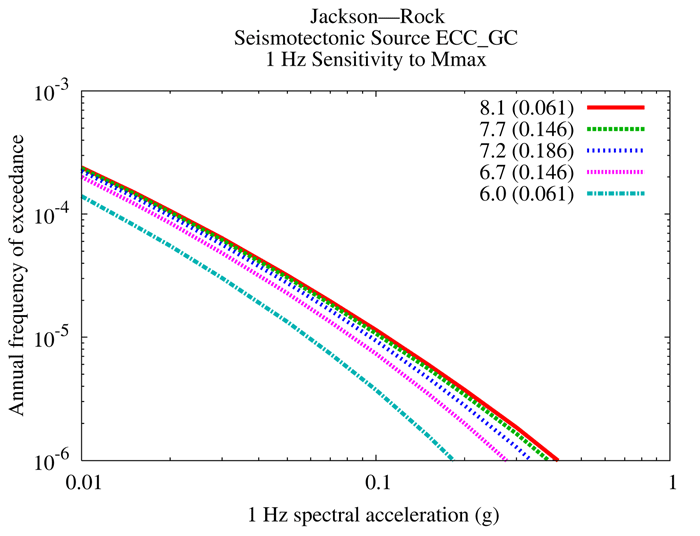
Figure 8.2-4z
Jackson 10 Hz rock hazard: sensitivity to smoothing options

Figure 8.2-4aa
Jackson 1 Hz rock hazard: sensitivity to smoothing options

Figure 8.2-4bb
Jackson 10 Hz rock hazard: sensitivity to eight realizations for source ECC-GC, Case A

Figure 8.2-4cc
Jackson 10 Hz rock hazard: sensitivity to eight realizations for source ECC-GC, Case B
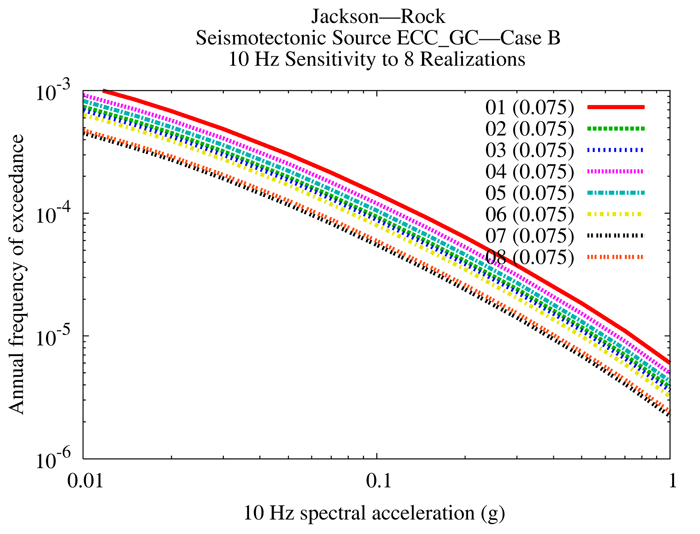
Figure 8.2-4dd
Jackson 10 Hz rock hazard: sensitivity to eight realizations for source ECC-GC, Case E
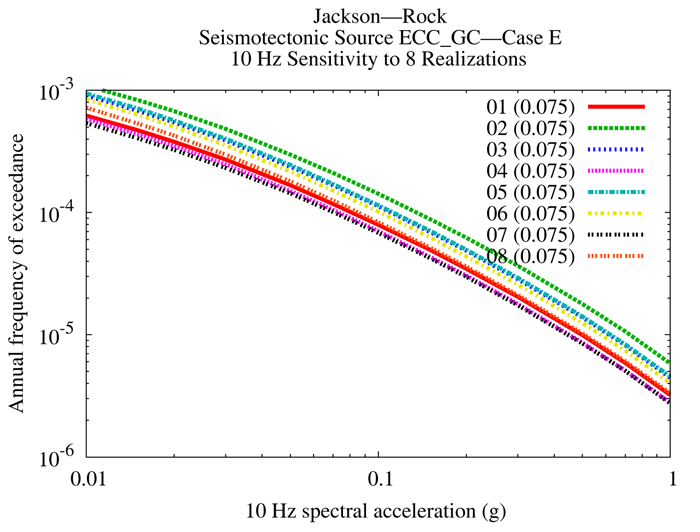
Figure 8.2-4ee
Jackson 1 Hz rock hazard: sensitivity to eight realizations for source ECC-GC, Case A

Figure 8.2-4ff
Jackson 1 Hz rock hazard: sensitivity to eight realizations for source ECC GC, Case B

Figure 8.2-4gg
Jackson 1 Hz rock hazard: sensitivity to eight realizations for source ECC-GC, Case E

Figure 8.2-5a
Manchester 10 Hz rock hazard: mean and fractile total hazard
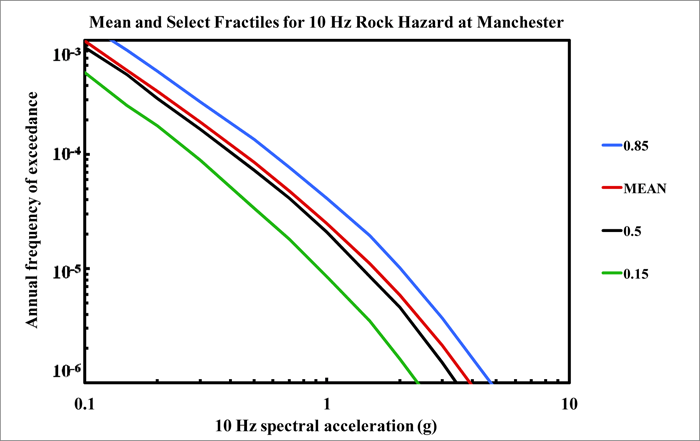
Figure 8.2-5b
Manchester 1 Hz rock hazard: mean and fractile total hazard
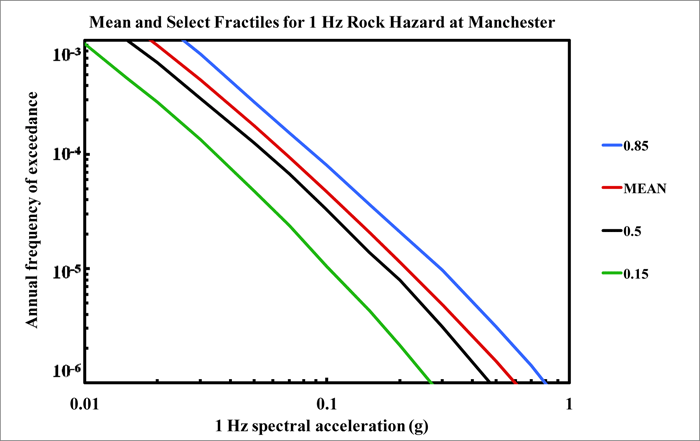
Figure 8.2-5c
Manchester PGA rock hazard: mean and fractile total hazard
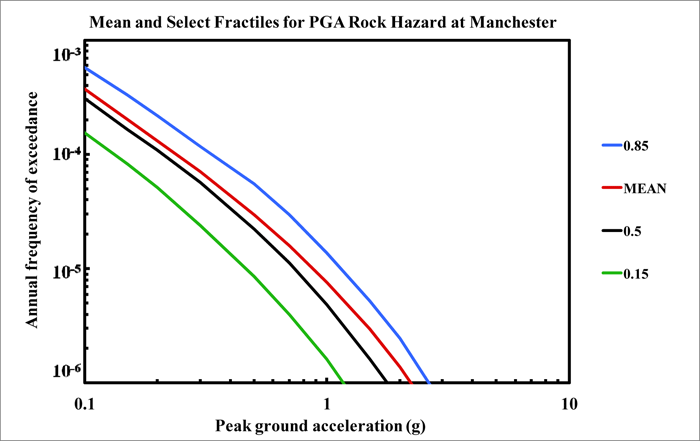
Figure 8.2-5d
Manchester 10 Hz rock hazard: total and contribution by RLME and background

Figure 8.2-5e
Manchester 1 Hz rock hazard: total and contribution by RLME and background
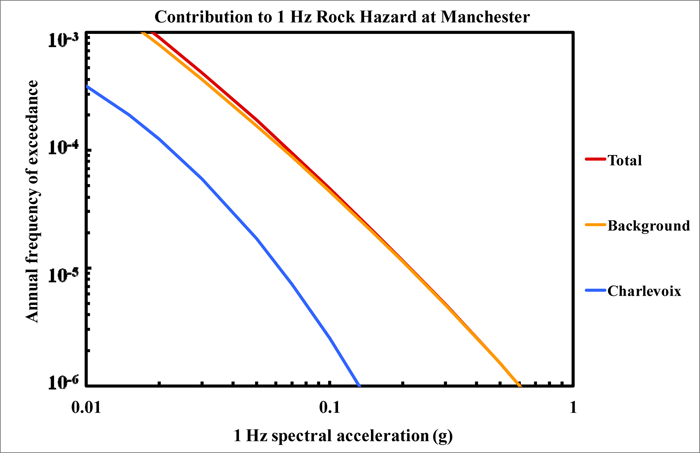
Figure 8.2-5f
Manchester PGA rock hazard: total and contribution by RLME and background
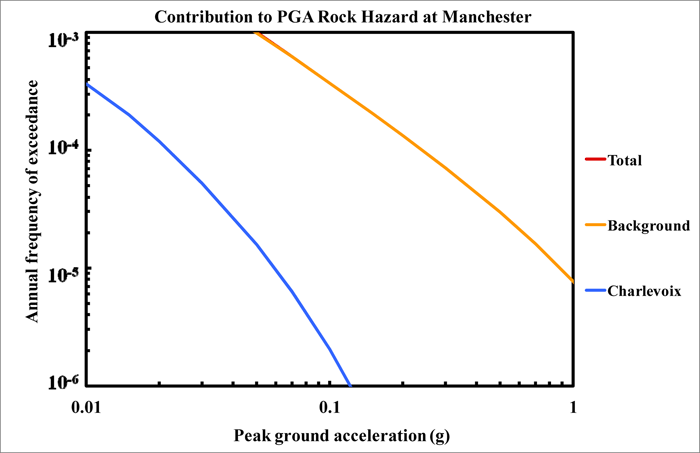
Figure 8.2-5g
Manchester 10 Hz rock hazard: contribution by background source
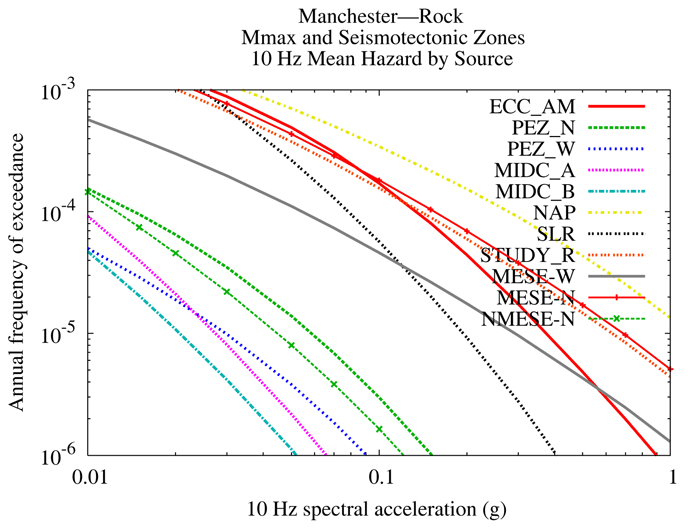
Figure 8.2-5h
Manchester 1 Hz rock hazard: contribution by background source
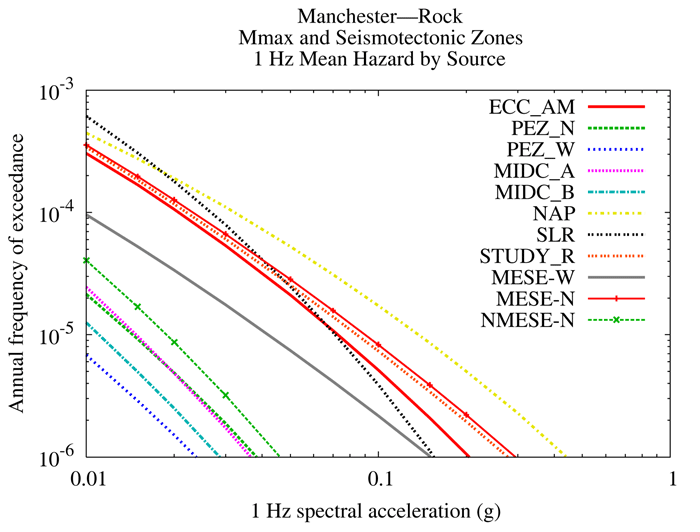
Figure 8.2-5i
Manchester PGA rock hazard: contribution by background source
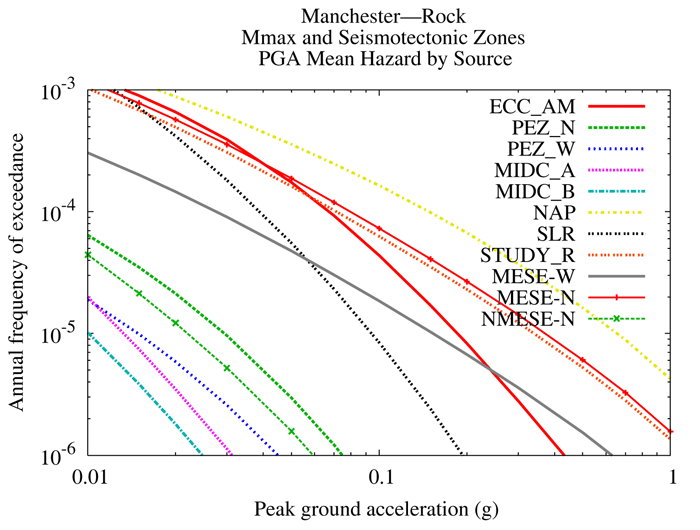
Figure 8.2-5j
Manchester 10 Hz rock hazard: comparison of three source models

Figure 8.2-5k
Manchester is 1 Hz rock hazard: comparison of three source models

Figure 8.2-5l
Manchester PGA rock hazard: comparison of three source models

Figure 8.2-5m
Manchester 10 Hz shallow soil hazard: total and contribution by RLME and background

Figure 8.2-5n
Manchester 1 Hz shallow soil hazard: total and contribution by RLME and background

Figure 8.2-5o
Manchester PGA shallow soil hazard: total and contribution by RLME and background

Figure 8.2-5p
Manchester 10 Hz deep soil hazard: total and contribution by RLME and background
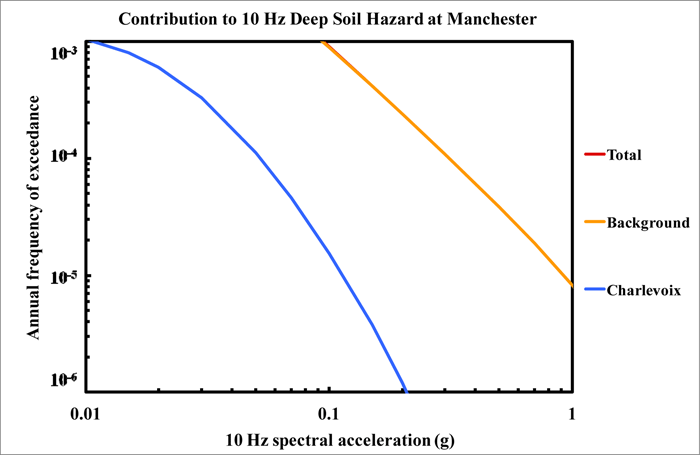
Figure 8.2-5q
Manchester 1 Hz deep soil hazard: total and contribution by RLME and background
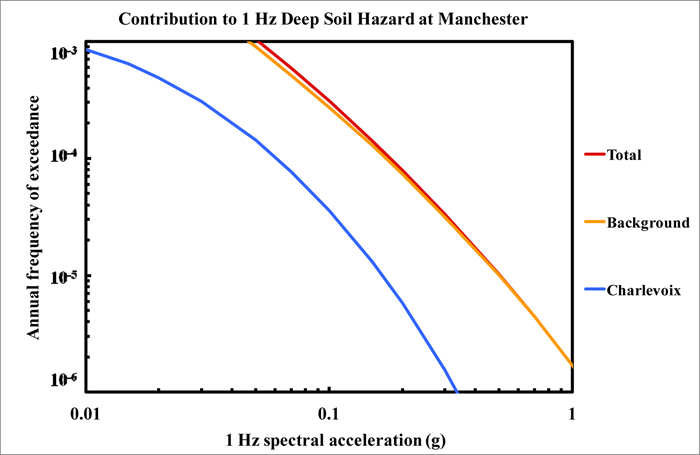
Figure 8.2-5r
Manchester PGA deep soil hazard: total and contribution by RLME and background

Figure 8.2-5s
Manchester 10 Hz hazard: comparison of three site conditions
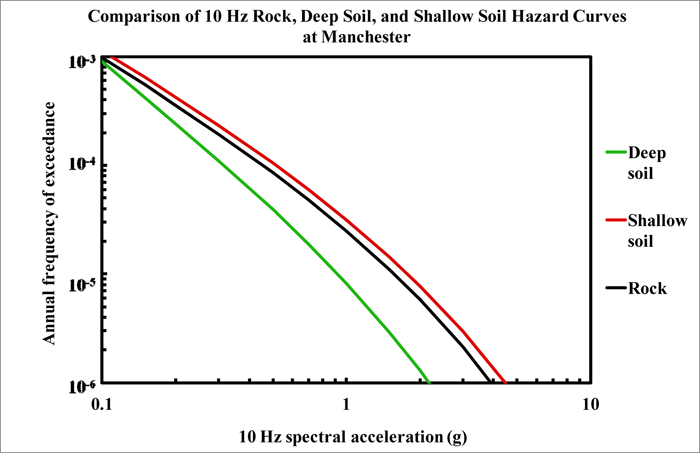
Figure 8.2-5t
Manchester 1 Hz hazard: comparison of three site conditions

Figure 8.2-5u
Manchester PGA hazard: comparison of three site conditions

Figure 8.2-5v
Manchester 10 Hz rock hazard: sensitivity to seismotectonic vs. Mmax zones

Figure 8.2-5w
Manchester 1 Hz rock hazard: sensitivity to seismotectonic vs. Mmax zones
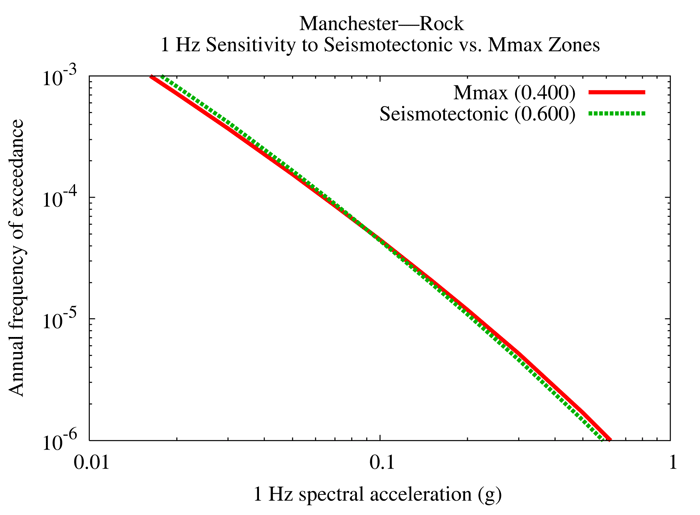
Figure 8.2-5x
Manchester 10 Hz rock hazard: sensitivity to Mmax for source NAP
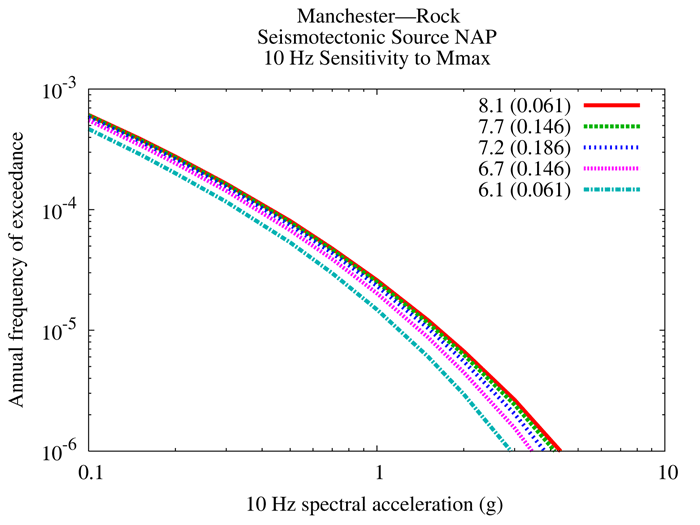
Figure 8.2-5y
Manchester 1 Hz rock hazard: sensitivity to Mmax for source NAP

Figure 8.2-5z
Manchester 10 Hz rock hazard: sensitivity to smoothing options

Figure 8.2-5aa
Manchester 1 Hz rock hazard: sensitivity to smoothing options
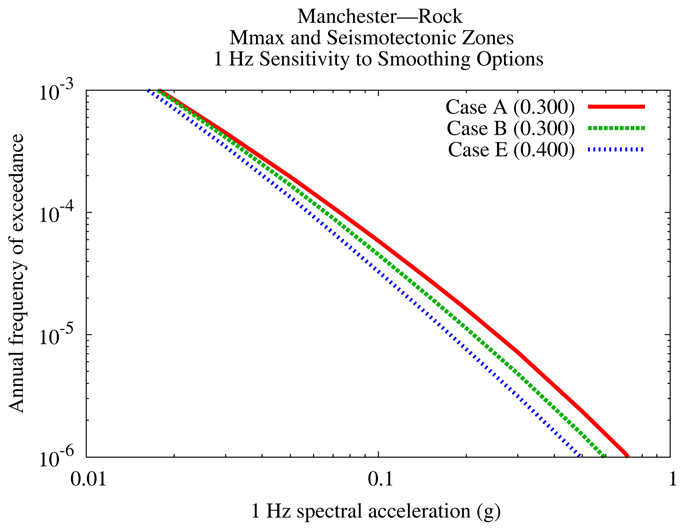
Figure 8.2-5bb
Manchester 10 Hz rock hazard: sensitivity to eight realizations for source NAP, Case A

Figure 8.2-5cc
Manchester 10 Hz rock hazard: sensitivity to eight realizations for source NAP, Case B
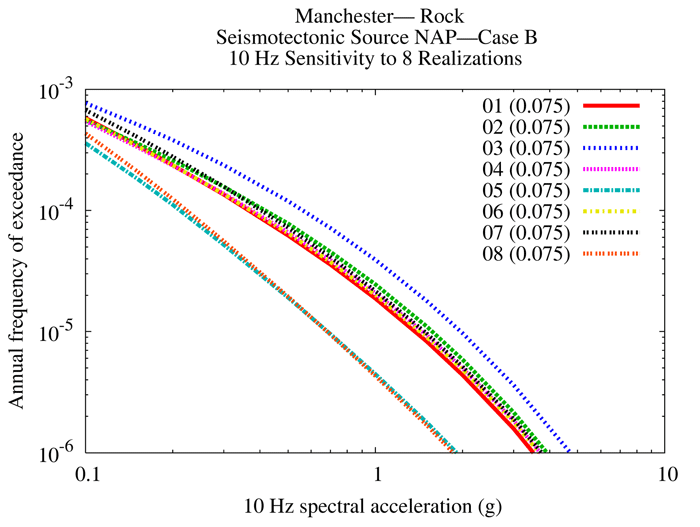
Figure 8.2-5dd
Manchester 10 Hz rock hazard: sensitivity to eight realizations for source NAP, Case E
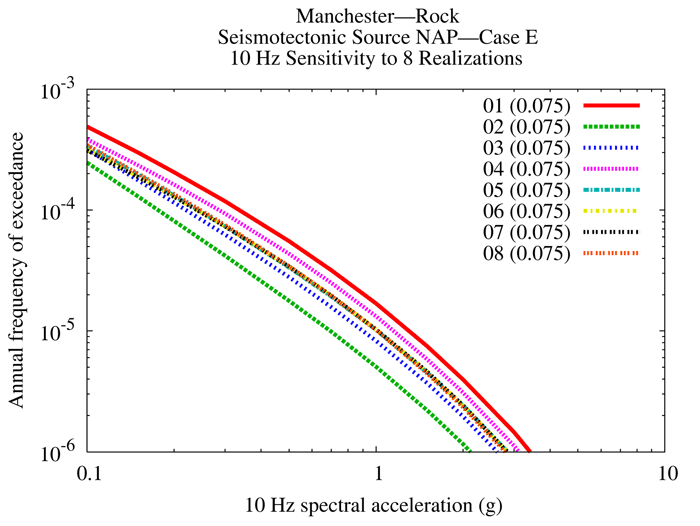
Figure 8.2-5ee
Manchester 1 Hz rock hazard: sensitivity to eight realizations for source NAP, Case A

Figure 8.2-5ff
Manchester 1 Hz rock hazard: sensitivity to eight realizations for source NAP, Case B
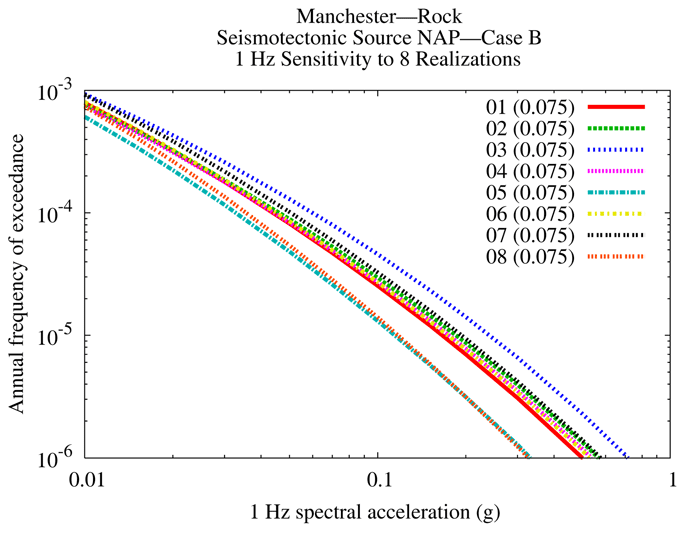
Figure 8.2-5gg
Manchester 1 Hz rock hazard: sensitivity to eight realizations for source NAP, Case E

Figure 8.2-6a
Savannah 10 Hz rock hazard: mean and fractile total hazard
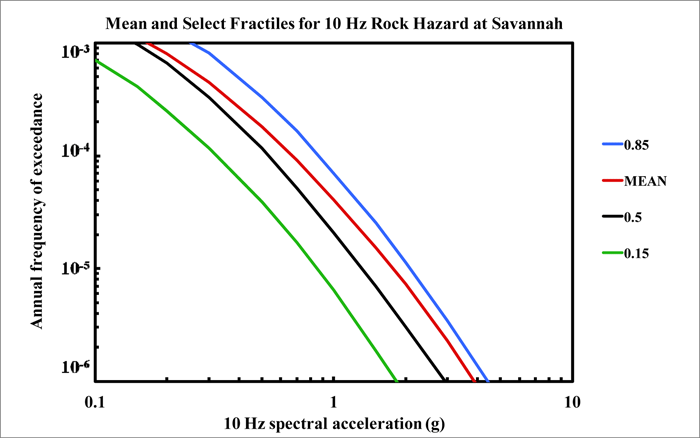
Figure 8.2-6b
Savannah 1 Hz rock hazard: mean and fractile total hazard
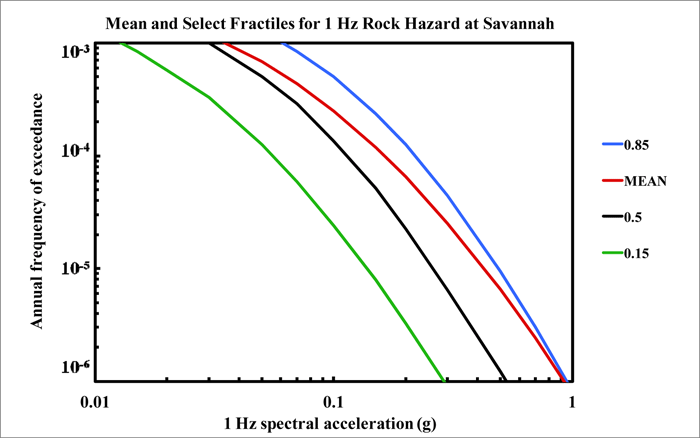
Figure 8.2-6c
Savannah PGA rock hazard: mean and fractile total hazard
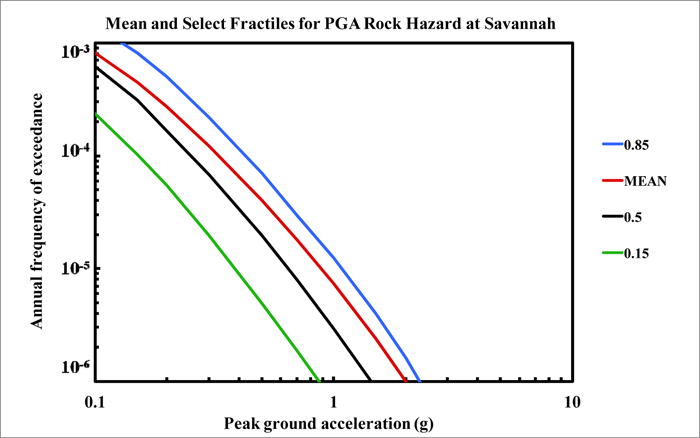
Figure 8.2-6d
Savannah 10 Hz rock hazard: total and contribution by RLME and background

Figure 8.2-6e
Savannah 1 Hz rock hazard: total and contribution by RLME and background

Figure 8.2-6f
Savannah PGA rock hazard: total and contribution by RLME and background

Figure 8.2-6g
Savannah 10 Hz rock hazard: contribution by background source

Figure 8.2-6h
Savannah 1 Hz rock hazard: contribution by background source
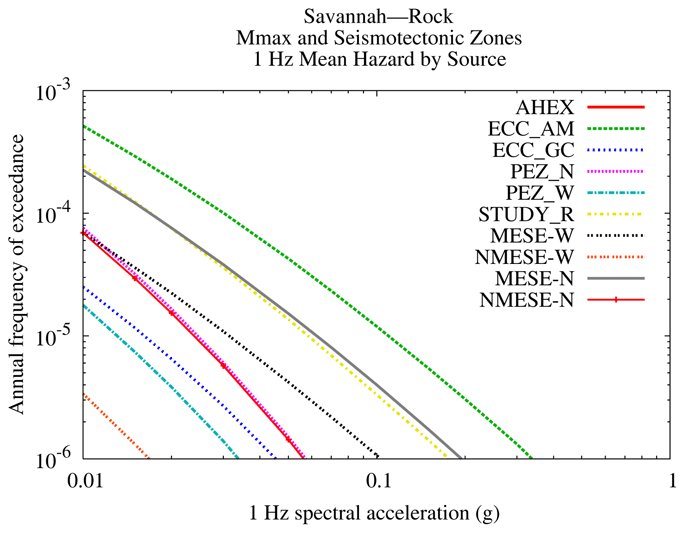
Figure 8.2-6i
Savannah PGA rock hazard: contribution by background source
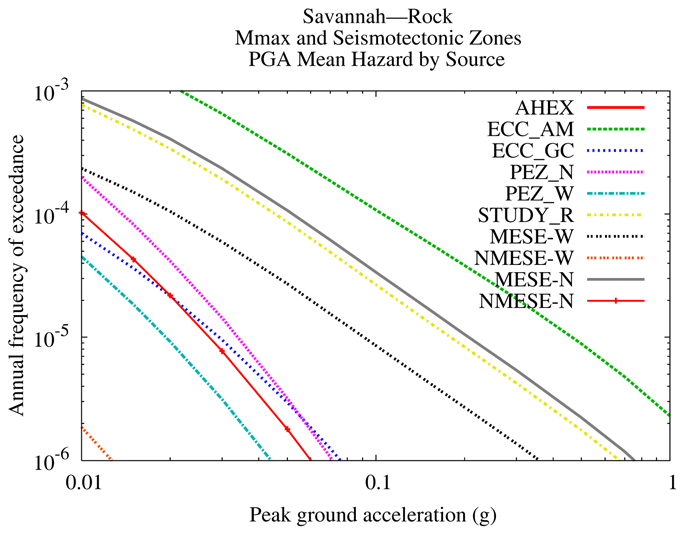
Figure 8.2-6j
Savannah 10 Hz rock hazard: comparison of three source models
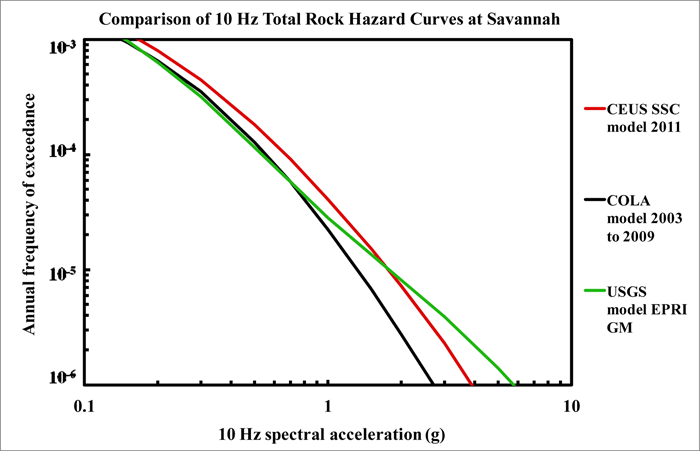
Figure 8.2-6k
Savannah is 1 Hz rock hazard: comparison of three source models
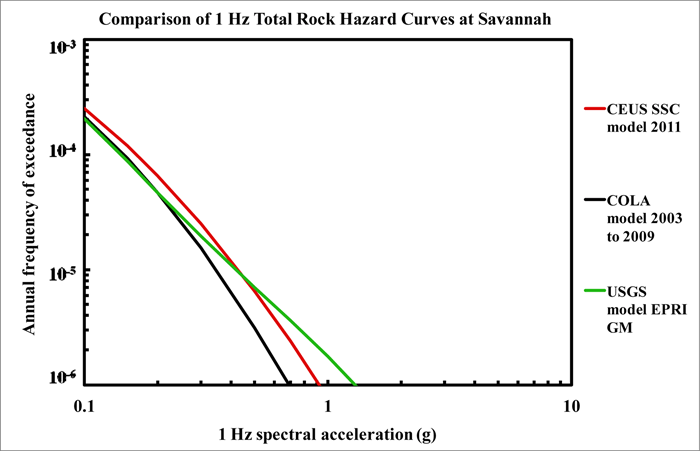
Figure 8.2-6l
Savannah PGA rock hazard: comparison of three source models
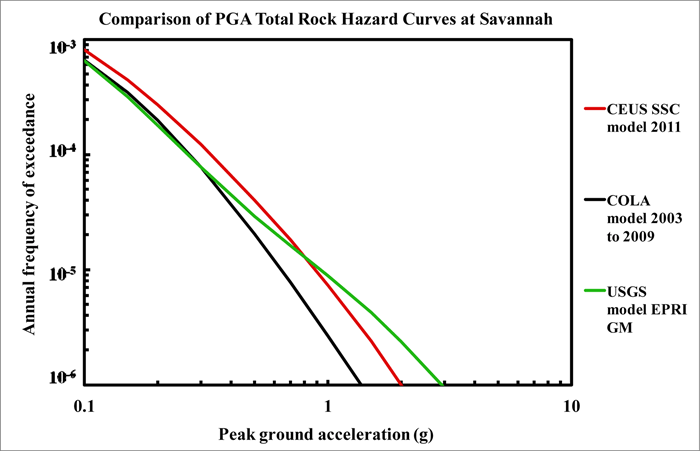
Figure 8.2-6m
Savannah 10 Hz shallow soil hazard: total and contribution by RLME and background
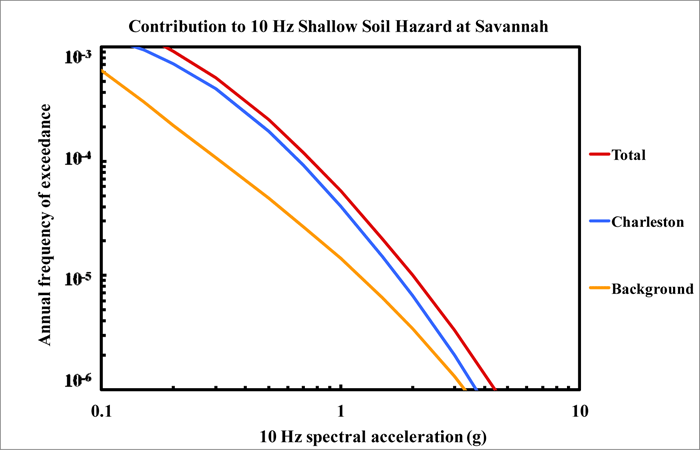
Figure 8.2-6n
Savannah 1 Hz shallow soil hazard: total and contribution by RLME and background
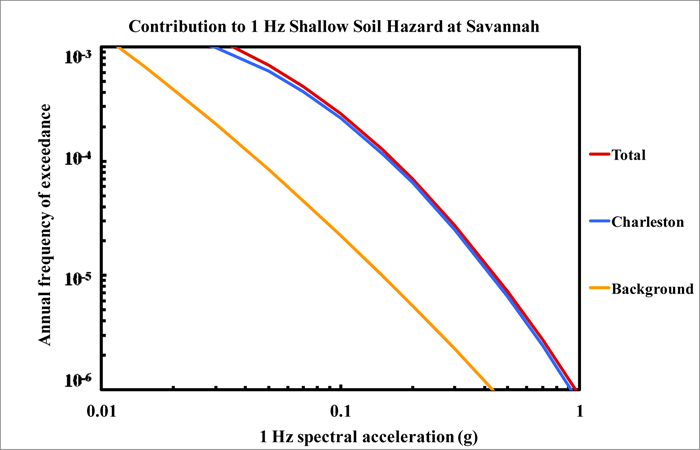
Figure 8.2-6o
Savannah PGA shallow soil hazard: total and contribution by RLME and background
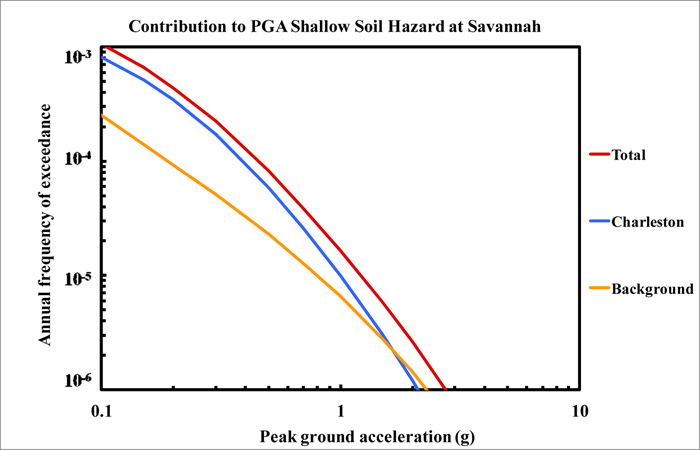
Figure 8.2-6p
Savannah 10 Hz deep soil hazard: total and contribution by RLME and background
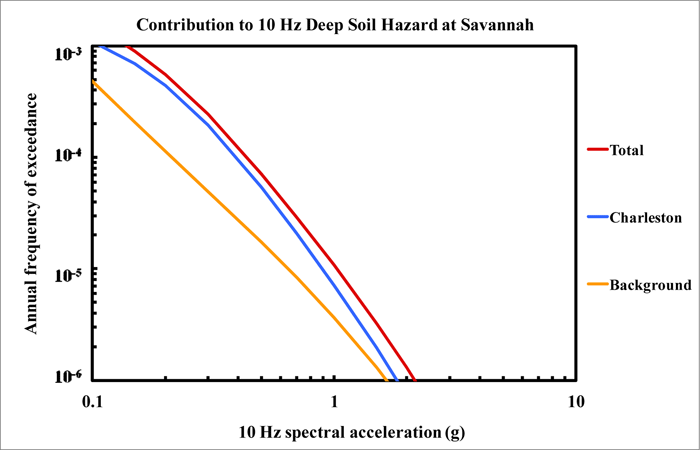
Figure 8.2-6q
Savannah 1 Hz deep soil hazard: total and contribution by RLME and background
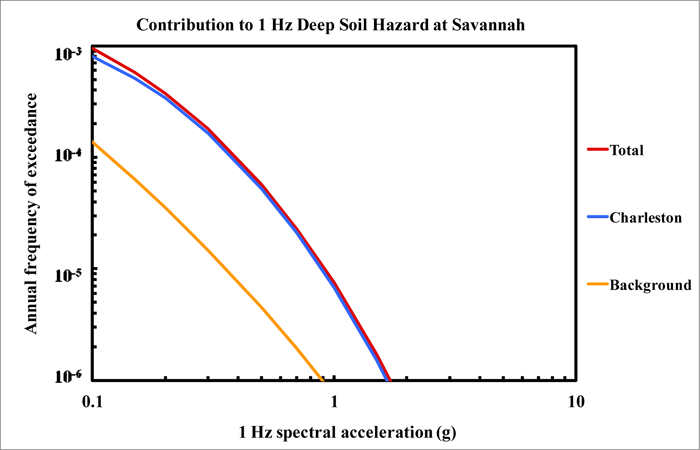
Figure 8.2-6r
Savannah PGA deep soil hazard: total and contribution by RLME and background
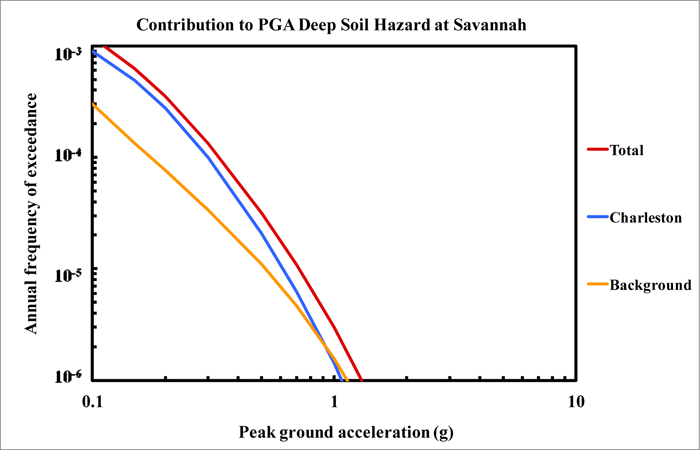
Figure 8.2-6s
Savannah 10 Hz hazard: comparison of three site conditions

Figure 8.2-6t
Savannah 1 Hz hazard: comparison of three site conditions

Figure 8.2-6u
Savannah PGA hazard: comparison of three site conditions

Figure 8.2-6v
Savannah 10 Hz rock hazard: sensitivity to seismotectonic vs. Mmax zones

Figure 8.2-6w
Savannah 1 Hz rock hazard: sensitivity to seismotectonic vs. Mmax zones
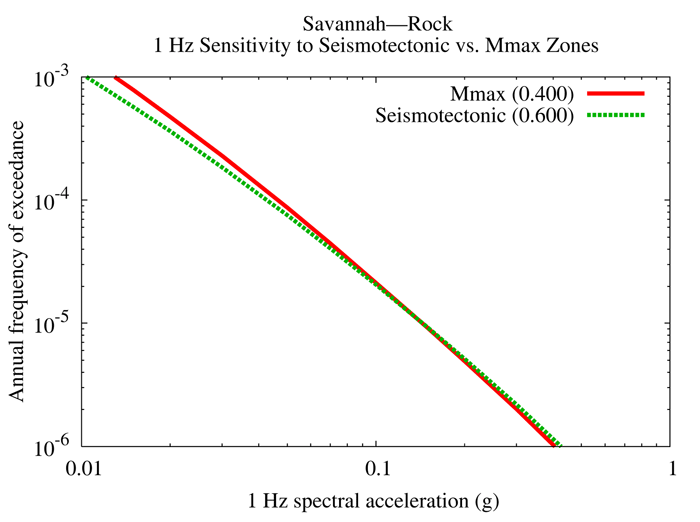
Figure 8.2-6x
Savannah 10 Hz rock hazard: sensitivity to Mmax for source ECC-AM

Figure 8.2-6y
Savannah 1 Hz rock hazard: sensitivity to Mmax for source ECC-AM

Figure 8.2-6z
Savannah 10 Hz rock hazard: sensitivity to smoothing options

Figure 8.2-6aa
Savannah 1 Hz rock hazard: sensitivity to smoothing options

Figure 8.2-6bb
Savannah 10 Hz rock hazard: sensitivity to eight realizations for source ECC-AM, Case A

Figure 8.2-6cc
Savannah 10 Hz rock hazard: sensitivity to eight realizations for source ECC-AM, Case B
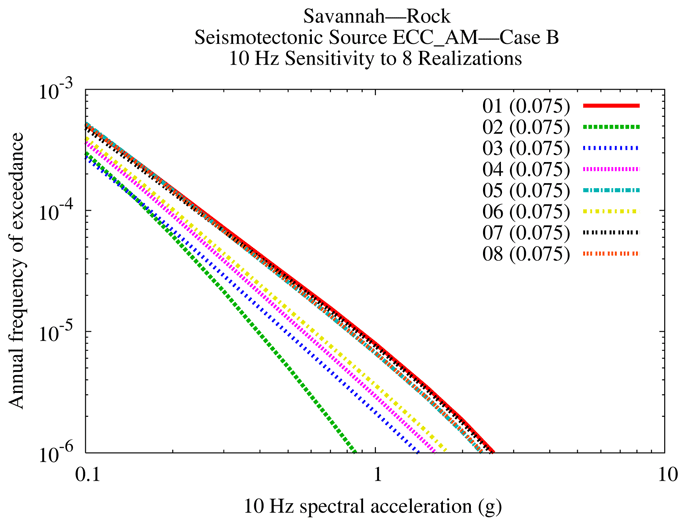
Figure 8.2-6dd
Savannah 10 Hz rock hazard: sensitivity to eight realizations for source ECC-AM, Case E
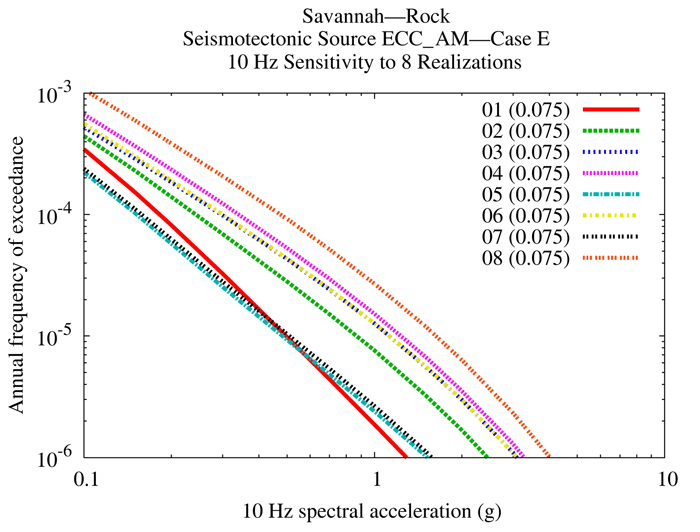
Figure 8.2-6ee
Savannah 1 Hz rock hazard: sensitivity to eight realizations for source ECC-AM, Case A

Figure 8.2-6ff
Savannah 1 Hz rock hazard: sensitivity to eight realizations for source ECC-AM, Case B
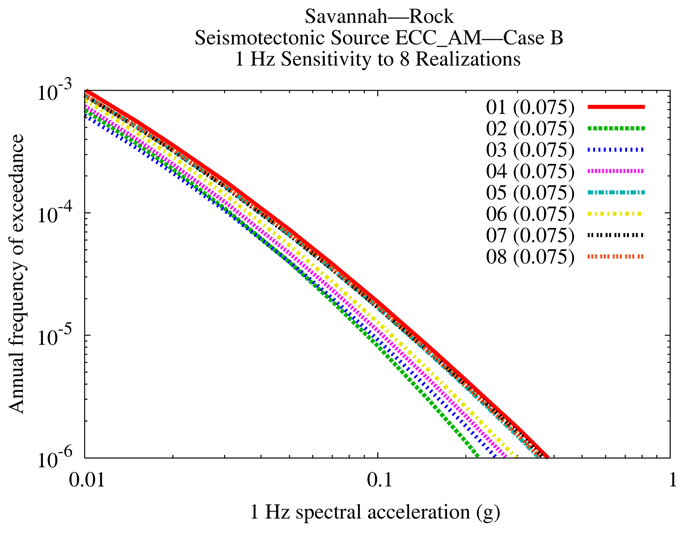
Figure 8.2-6gg
Savannah 1 Hz rock hazard: sensitivity to eight realizations for source ECC-AM, Case E
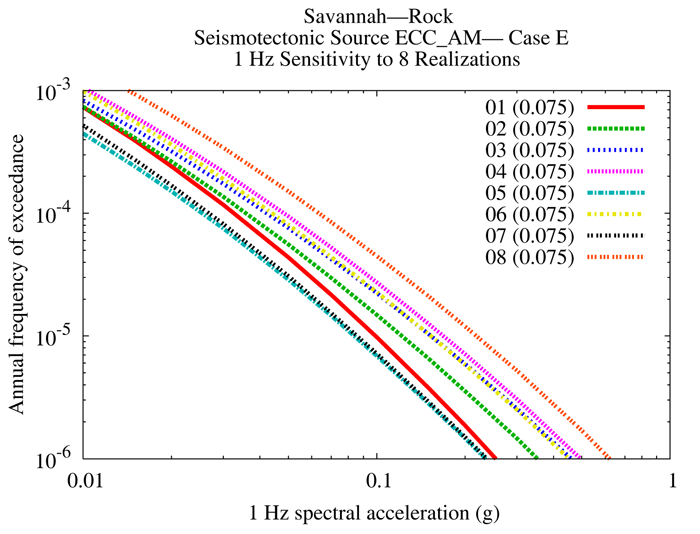
Figure 8.2-7a
Topeka 10 Hz rock hazard: mean and fractile total hazard
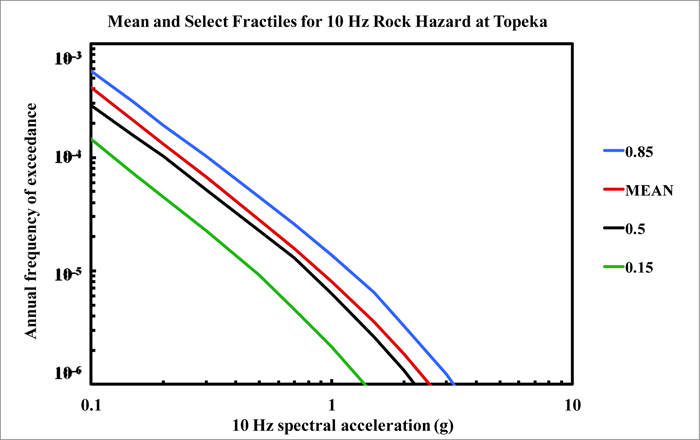
Figure 8.2-7b
Topeka 1 Hz rock hazard: mean and fractile total hazard

Figure 8.2-7c
Topeka PGA rock hazard: mean and fractile total hazard

Figure 8.2-7d
Topeka 10 Hz rock hazard: total and contribution by RLME and background
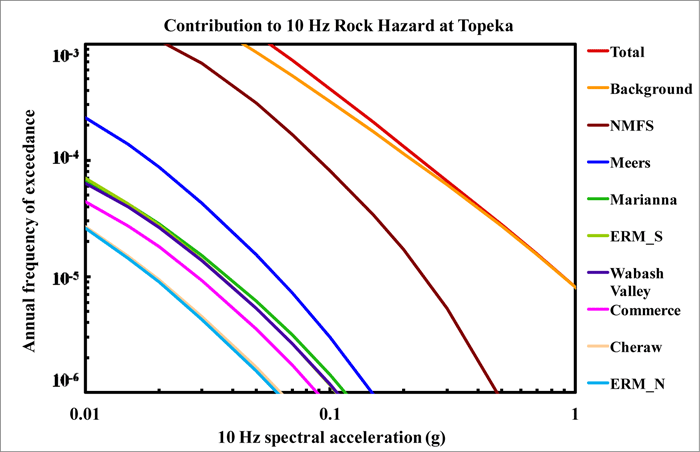
Figure 8.2-7e
Topeka 1 Hz rock hazard: total and contribution by RLME and background

Figure 8.2-7f
Topeka PGA rock hazard: total and contribution by RLME and background

Figure 8.2-7g
Topeka 10 Hz rock hazard: contribution by background source
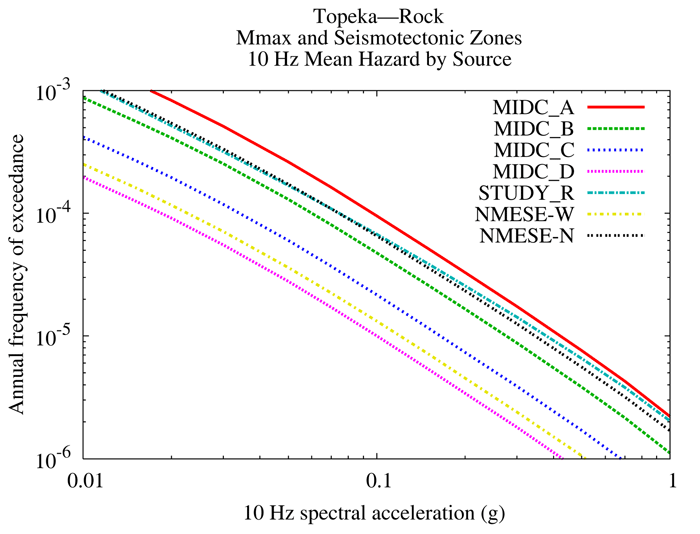
Figure 8.2-7h
Topeka 1 Hz rock hazard: contribution by background source

Figure 8.2-7i
Topeka PGA rock hazard: contribution by background source
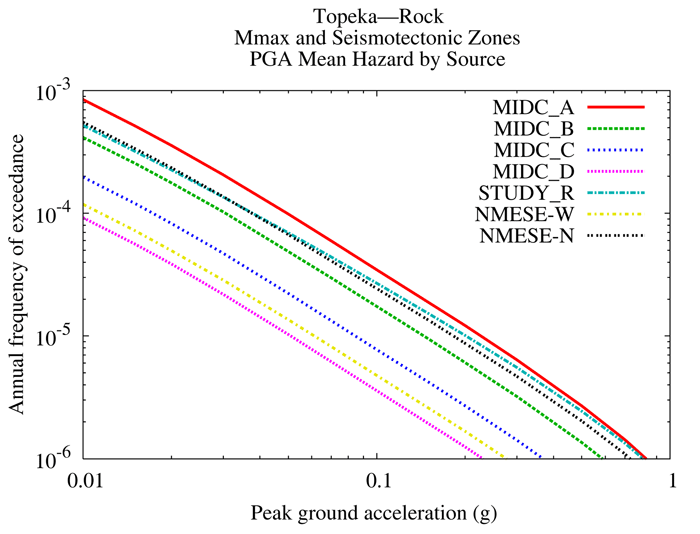
Figure 8.2-7j
Topeka 10 Hz rock hazard: comparison of three source models
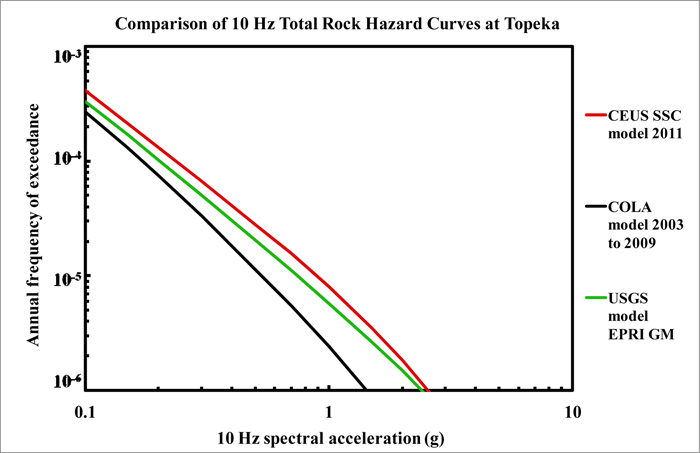
Figure 8.2-7k
Topeka is 1 Hz rock hazard: comparison of three source models

Figure 8.2-7l
Topeka PGA rock hazard: comparison of three source models

Figure 8.2-7m
Topeka 10 Hz shallow soil hazard: total and contribution by RLME and background

Figure 8.2-7n
Topeka 1 Hz shallow soil hazard: total and contribution by RLME and background
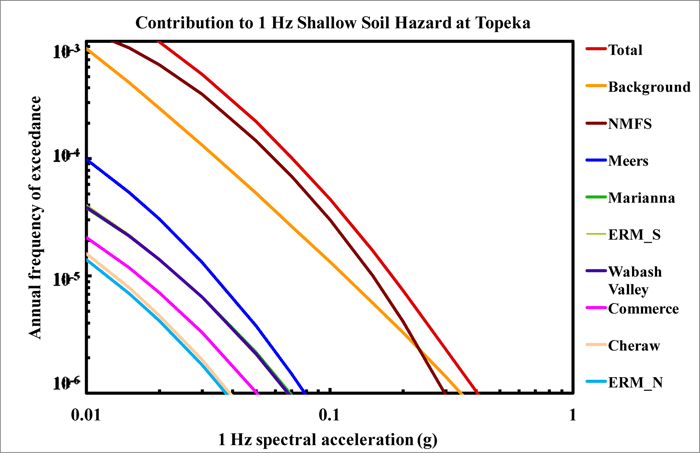
Figure 8.2-7o
Topeka PGA shallow soil hazard: total and contribution by RLME and background
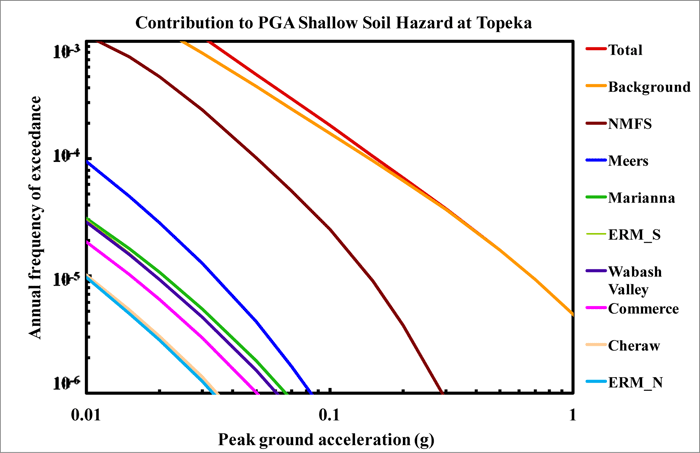
Figure 8.2-7p
Topeka 10 Hz deep soil hazard: total and contribution by RLME and background
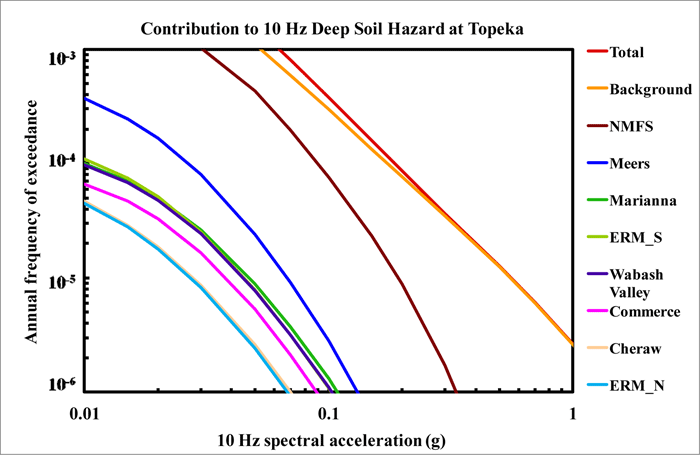
Figure 8.2-7q
Topeka 1 Hz deep soil hazard: total and contribution by RLME and background

Figure 8.2-7r
Topeka PGA deep soil hazard: total and contribution by RLME and background
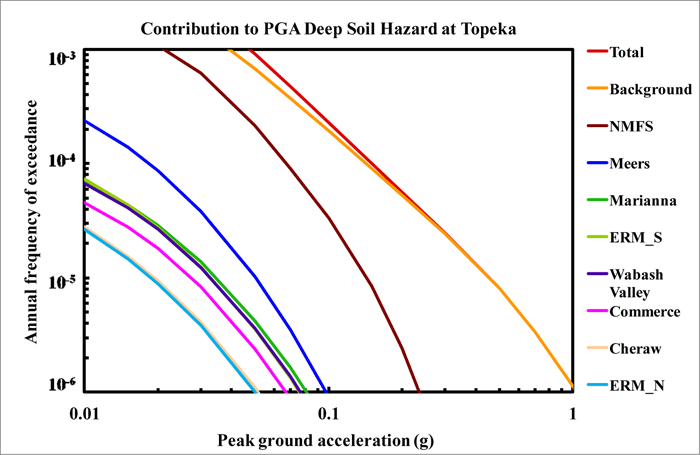
Figure 8.2-7s
Topeka 10 Hz hazard: comparison of three site conditions
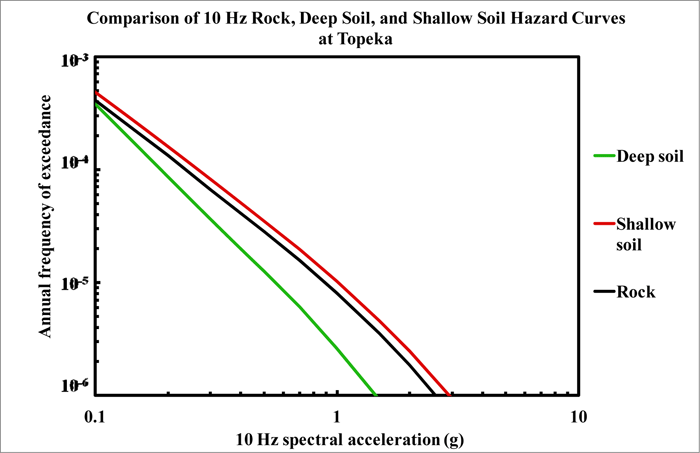
Figure 8.2-7t
Topeka 1 Hz hazard: comparison of three site conditions

Figure 8.2-7u
Topeka PGA hazard: comparison of three site conditions

Figure 8.2-7v
Topeka 10 Hz rock hazard: sensitivity to seismotectonic vs. Mmax zones

Figure 8.2-7w
Topeka 1 Hz rock hazard: sensitivity to seismotectonic vs. Mmax zones.

Figure 8.2-7x
Topeka 10 Hz rock hazard: sensitivity to Mmax for source MidC-A

Figure 8.2-7y
Topeka 1 Hz rock hazard: sensitivity to Mmax for source MidC-A

Figure 8.2-7z
Topeka 10 Hz rock hazard: sensitivity to smoothing options
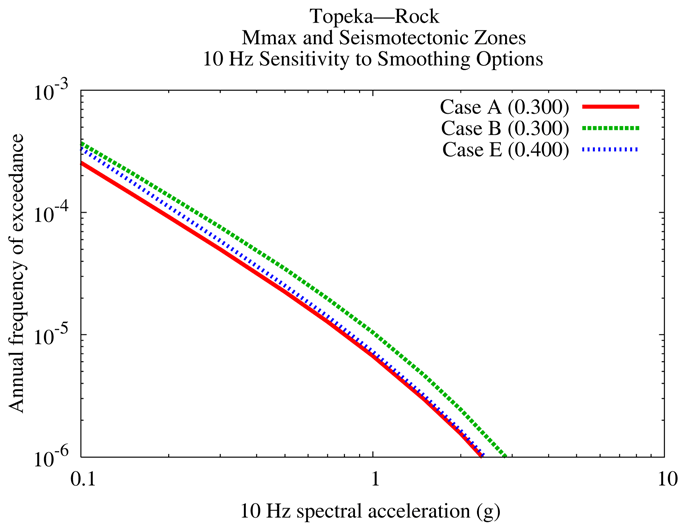
Figure 8.2-7aa
Topeka 1 Hz rock hazard: sensitivity to smoothing options

Figure 8.2-7bb
Topeka 10 Hz rock hazard: sensitivity to eight realizations for source MidC-A, Case A

Figure 8.2-7cc
Topeka 10 Hz rock hazard: sensitivity to eight realizations for source MidC-A, Case B
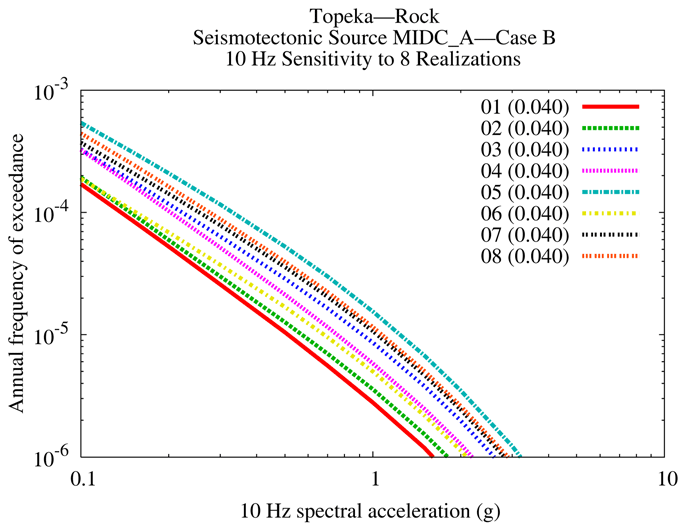
Figure 8.2-7dd
Topeka 10 Hz rock hazard: sensitivity to eight realizations for source MidC-A, Case E
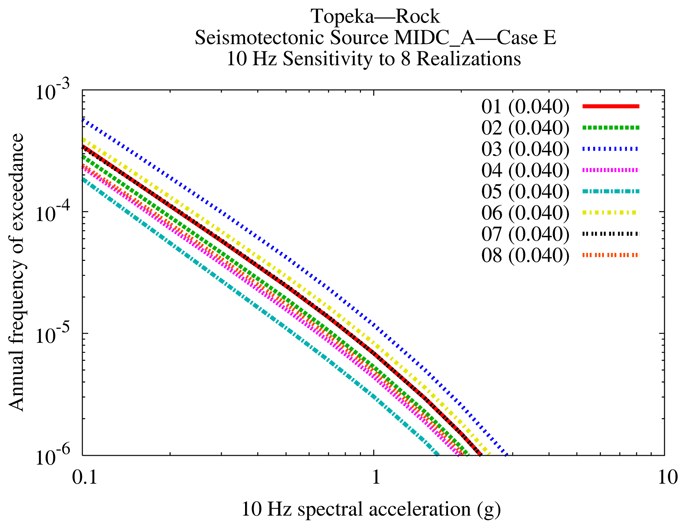
Figure 8.2-7ee
Topeka 1 Hz rock hazard: sensitivity to eight realizations for source MidC-A, Case A

Figure 8.2-7ff
Topeka 1 Hz rock hazard: sensitivity to eight realizations for source MidC-A, Case B
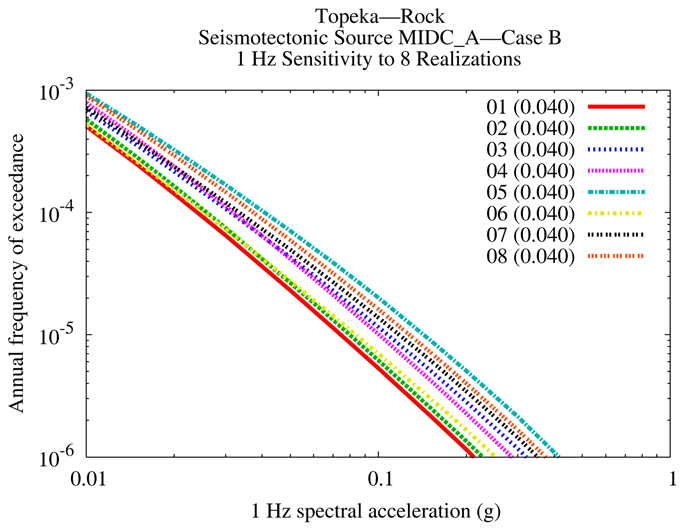
Figure 8.2-7gg
Topeka 1 Hz rock hazard: sensitivity to eight realizations for source MidC-A, Case E
